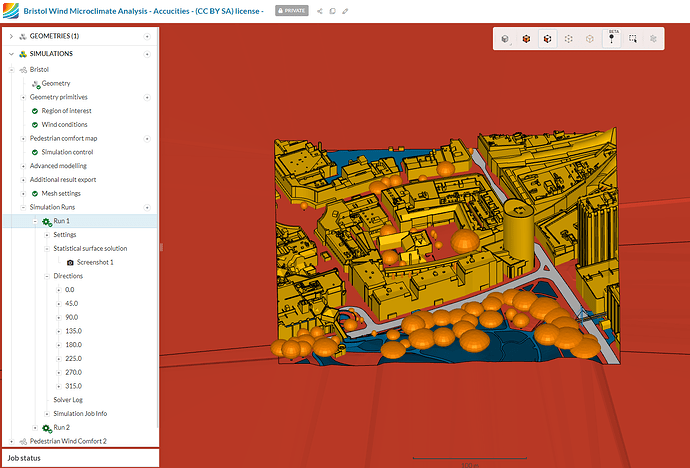
Whenever you run a pedestrian wind comfort simulation you always get access to both the statistical average solution (wind comfort plot) and the wind directional results (shown below).
Regarding the question of this post, there is a distinction that should be made clear between those two.
The results per directions are purely based on CFD and are not weighted by probabilities coming from the wind rose.
Essentially, for each wind direction, the Atmospheric Boundary Layer (ABL) profile associated with each wind direction is simulated as incoming wind.
We use 10 m/s at 10 m height and the aerodynamic roughness from the wind exposure category associated with each wind direction, as parameters for the ABL generation.
However, the statistical averaging (the one where you can visualize the comfort map) is where the wind speed probability based on the windrose is taken into account.
In this step the probability of a wind speed at a particular point (which is obtained from the directional results) exceeding a threshold (based on wind comfort standard) is calculated.
This [documentation ] (section 6) explains how the probability of wind coming from a certain wind direction is incorporated into the wind comfort map calculation.
