Paraview doesn’t document its legend format very well, however, there is a good resource that defines the types of legend tick here:
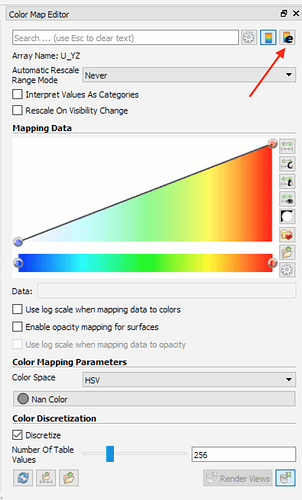
When you edit a colour map there is an option to edit the legend:
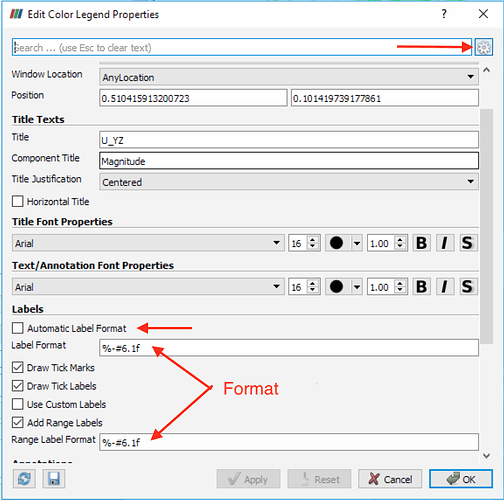
And here you can change to advance settings and alter the tick formats:
Here the format will produce a float with a single decimal place for both the ticks and the ranges, further by using custom labels you can ensure that there are ticks exactly where you want, for example, if you only want a single tick in the middle just specify the halfway value and you will have just the range values and the single mid point tick.
Hope this helps,
Darren

