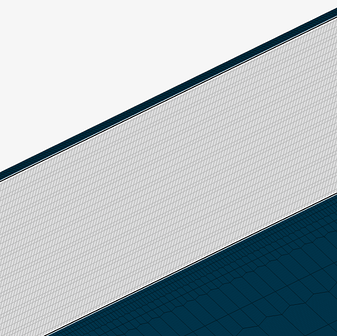
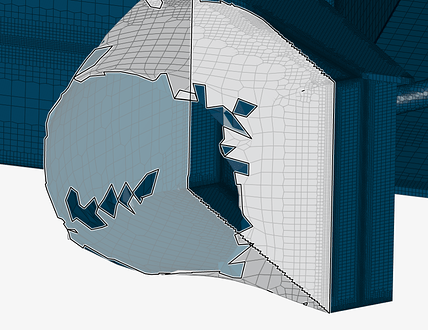
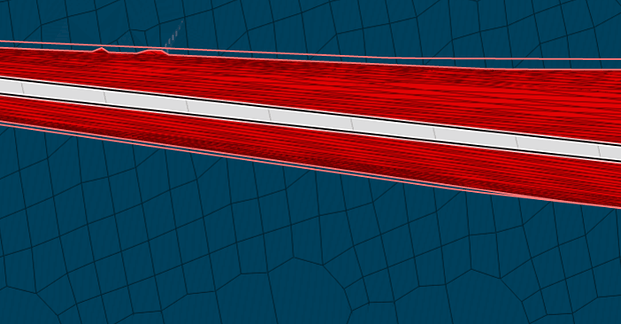
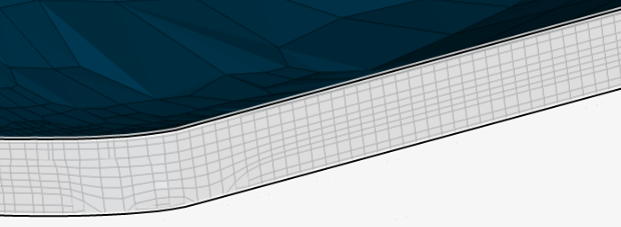
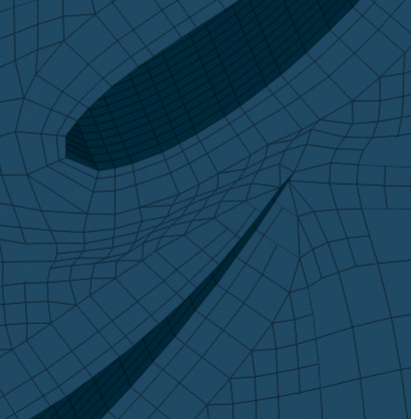
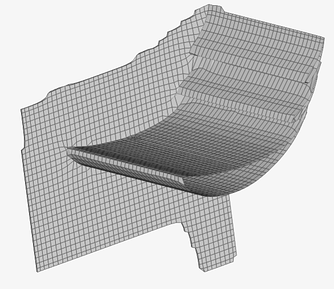
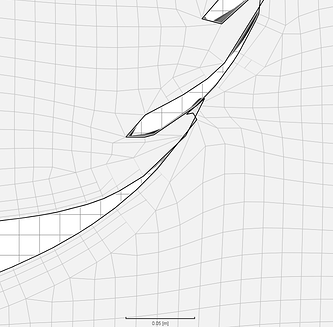
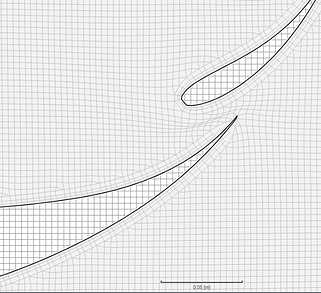
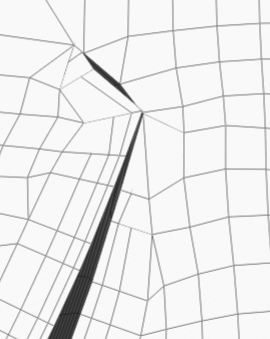
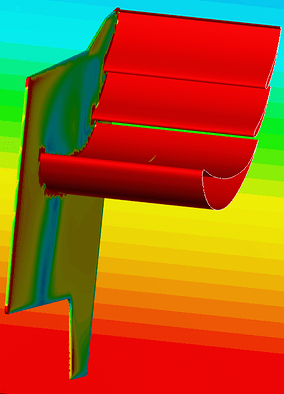
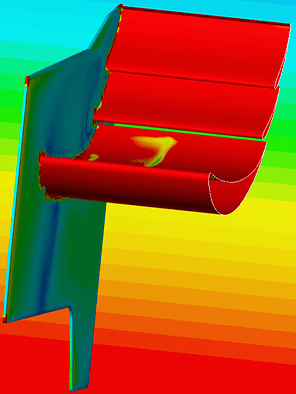
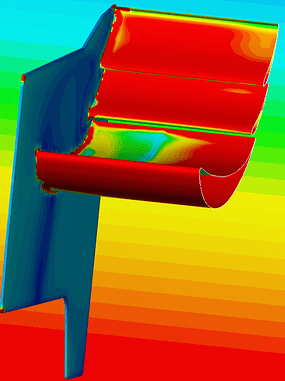
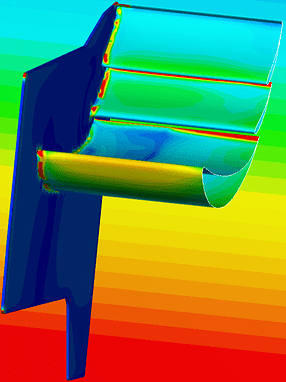
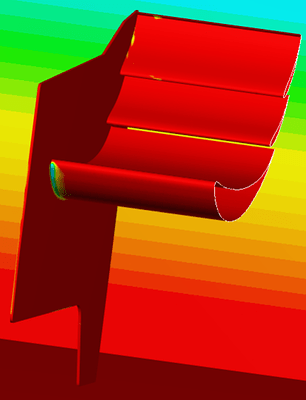
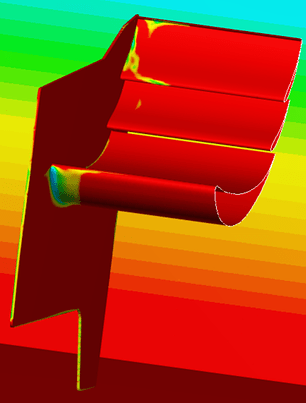
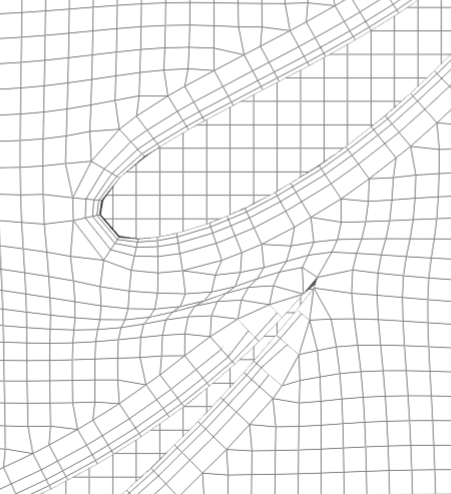
New meshing strategy
New Y+ range based on successful surface refinement cell sizes
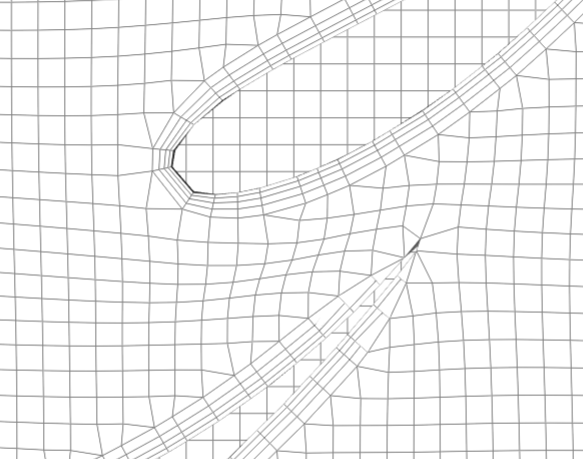
We will now calculate back, starting with our surface refinement size to find the correct Y+ Range. Starting with the following equation to find a reasonable 3rd layer thickness cell size for all non-winged surfaces
Calculation #1
final layer thickness ratio = 3rd layer thickness / surface refinement Level size
0.4 = X / 0.0075
X = 0.4 * 0.0075
X = 0.003m
This is our 3rd laver cell size.
To estimate our upper limit Y+, we must first find the correct expansion ratio to get from our first layer cell size at Y+ = 100 which is 0.002165m to our 3rd cell size of 0.003m
The closest expansion ratio resulted in 1.18 which gives the following:
| Inflate boundary layer settings - layer calculation | Y+ Value | |
|---|---|---|
| Layers | 3 | |
| 1st | 0.002165m | Y+ = 100 |
| 2nd | 0.002554m | |
| 3rd | 0.003014m | |
| Overall thickness | 0.007733m | Y+ = 358 |
| Expansion ratio | 1.18 | |
| Min thickness | 0.001m | |
| Final layer thickness (RATIO) | 0.4 |
With an overall thickness value of 0.007733m the closest Y+ is 359 at 0.0077515m
While a Y+ range of 100-358 isnt that bad, the optimal final layer thickness ratio of 0.4 shows how the rest of these calculations are affected by this value.
There are two fixed values in all of our meshing calculations.
- Our first layer thickness Y+ value. This must be around 100
- Our surface refinement max cell size. For non-wing geometries this is 0.0075m and for winged geometries this is 0.00375m
There best way to increase our upper Y+ limit is to increase our final layer thickness ratio to allow for a larger 3rd layer cell, which will also increase our expansion ratio value to a more desirable level, and finally our overall thickness of the boundary level, which is our upper limit of the Y+ value.
Calculation #2
By changing the final layer thickness ratio to 0.6 our new upper limit Y+ Value will be calculated.
0.6 = X / 0.0075
X = 0.6 * 0.0075
X = 0.0045m
This is our 3rd laver cell size.
To estimate our upper limit Y+, we must first find the correct expansion ratio to get from our first layer cell size at Y+ = 100 which is 0.002165m to our 3rd cell size of 0.0045m
The closest expansion ratio resulted in 1.45 which gives the following:
| Inflate boundary layer settings - layer calculation | Y+ Value | |
|---|---|---|
| Layers | 3 | |
| 1st | 0.002165m | Y+ = 100 |
| 2nd | 0.003139m | |
| 3rd | 0.0045519m | |
| Overall thickness | 0.009855m | Y+ = 455 |
| Expansion ratio | 1.45 | |
| Min thickness | 0.001m | |
| Final layer thickness (RATIO) | 0.6 |
With an overall thickness value of 0.009855m the closest Y+ is 455 at 0.0098518m
Calculation #3
By changing the final layer thickness ratio to 0.8 our new upper limit Y+ Value will be calculated and with a third data point, estimations can be made about the relation between final layer thickness ratio, expansion ratio, and Y+ upper limit
0.8 = X / 0.0075
X = 0.8 * 0.0075
X = 0.006m
This is our 3rd laver cell size.
To estimate our upper limit Y+, we must first find the correct expansion ratio to get from our first layer cell size at Y+ = 100 which is 0.002165m to our 3rd cell size of 0.006m
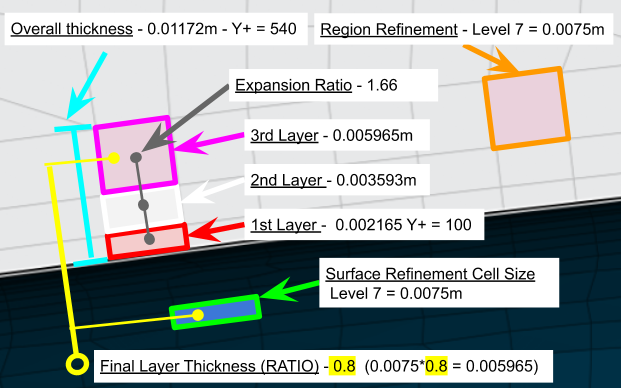
The closest expansion ratio resulted in 1.66 which gives the following:
| Inflate boundary layer settings - layer calculation | Y+ Value | |
|---|---|---|
| Layers | 3 | |
| 1st | 0.002165m | Y+ = 100 |
| 2nd | 0.003593m | |
| 3rd | 0.005965m | |
| Overall thickness | 0.01172m | Y+ = 540 |
| Expansion ratio | 1.66 | |
| Min thickness | 0.001m | |
| Final layer thickness (RATIO) | 0.8 |
With an overall thickness value of 0.01172m the closest Y+ is 540 at 0.0116922
Data relation table #1
By combining the results of all three calculations the following table give insight into the relations between these variables.
| Surface refinement cell size | Final layer thickness RATIO | First layer cell size Y+ = 100 | Expansion ratio | 3rd Layer cell size | Overall thickness | Y+ top limit value |
|---|---|---|---|---|---|---|
| 0.0075 | 0.4 | 0.002165m | 1.18 | 0.003m | 0.007733m | 358 |
| 0.0075 | 0.6 | 0.002165m | 1.45 | 0.0045m | 0.009855m | 455 |
| 0.0075 | 0.8 | 0.002165m | 1.66 | 0.006m | 0.01172m | 540 |
| Difference between Data | ||||||
| 0.4 - 0.6 | 0.2 | 0.27 | 0.0015m | 0.002122m | 97 | |
| 0.6 - 0.8 | 0.2 | 0.21 | 0.0015m | 0.001865m | 85 |
Calculation #4
Now the calculation will be made for wing surface refinements, with a surface refinement cell thickness of 0.00375 I will use a final layer thickness ratio to 0.8 for the new upper limit Y+ Value.
0.8 = X / 0.00375
X = 0.8 * 0.00375
X = 0.003m
This is our 3rd laver cell size.
Conveniently, our 3rd layer size is 0.003m which is already calculated in using the 0.0075 surface refinement level at 0.4 final layer thickness ratio shown in calculation #1.
The closest expansion ratio resulted in 1.18 which gives the following:
| Inflate boundary layer settings - layer calculation | Y+ Value | |
|---|---|---|
| Layers | 3 | |
| 1st | 0.002165m | Y+ = 100 |
| 2nd | 0.002554m | |
| 3rd | 0.003014m | |
| Overall thickness | 0.007733m | Y+ = 358 |
| Expansion ratio | 1.18 | |
| Min thickness | 0.001m | |
| Final layer thickness (RATIO) | 0.8 |
With an overall thickness value of 0.007733m the closest Y+ is 359 at 0.0077515m
Calculation #5
By referencing our table that related final layer thickness expansion ratios to Y+ upper limit values. We can estimate that there is an obvious correlation between final layer thickness expansion ratio that will give us an approximate Y+ upper limit value of 540, which will be true if X = 0.006 in the following equation.
1.2 = X / 0.00375
X = 1.2 * 0.00375
X = 0.0045m
As you can see the result is 0.0045m with an increase of 0.4 to the final layer thickness ratio. Since 0.00375 is exactly half or 0.0075 (one cell level down). We can surmise that adding 0.8 to our original final layer thickness expansion ratio of 0.8 will give us our desired 0.006 3rd layer thickness and our desired Y+ value of 540.
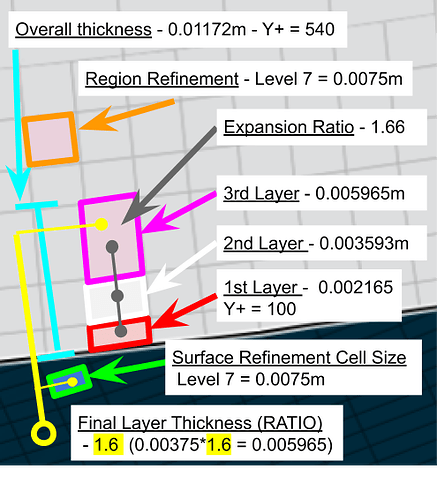
1.6 = X / 0.00375
X = 1.6 * 0.00375
X = 0.006m
This is our 3rd laver cell size.
We can simply use the same table data results from calculation #3
The closest expansion ratio resulted in 1.66 which gives the following:
| Inflate boundary layer settings - layer calculation | Y+ Value | |
|---|---|---|
| Layers | 3 | |
| 1st | 0.002165m | Y+ = 100 |
| 2nd | 0.003593m | |
| 3rd | 0.005965m | |
| Overall thickness | 0.01172m | Y+ = 540 |
| Expansion ratio | 1.66 | |
| Min thickness | 0.001m | |
| Final layer thickness (RATIO) | 0.8 |
With an overall thickness value of 0.01172m the closest Y+ is 540 at 0.0116922
Data relation table #2
| Surface refinement cell size | Final layer thickness RATIO | First layer cell size Y+ = 100 | Expansion ratio | 3rd Layer cell size | Overall thickness | Y+ top limit value |
|---|---|---|---|---|---|---|
| 0.00375 | 0.8 | 0.002165m | 1.18 | 0.003m | 0.007733m | 358 |
| 0.00375 | 1.6 | 0.002165m | 1.66 | 0.006m | 0.01172m | 540 |
| Difference between Data | ||||||
| 0.8 - 1.6 | 0.8 | 0.48 | 0.003m | 0.003987m | 182 |
This data shows that for two different surface refinement levels, in our case Level 5 (0.0075) and level 6 (0.00375) the final layer thickness ratio must be increased by 0.8 to achieve the same Y+ upper limit level.
HOWEVER, even though the Y+ limit range of 100 - 540 is equal between the two surface level refinements, with a final layer thickness ratio greater than 1.0, the 3rd layer thickness will be LARGER than the surface refinement cell size.
At this point I am unsure which is worse for the mesh quality, an unequal Y+ value range between boundary layer refinements
OR
A final layer thickness ratio greater than 1 which results in a 3rd layer cell size larger than the surface refinement cell size.
