Also before i run these simulations. Should i stop the iterations (timestep) at 2876 for the solution? I want to compare to your ORSI data. Is there another time ORSI is at 1% to reduce sim time or is this when you manually stopped it?
Give me link so I can look at CSV with ORSI…
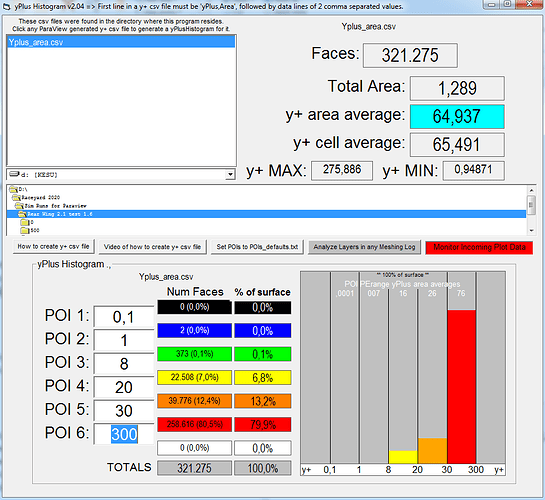
I didnt set up Y+ in result control for this yet
Sorry of the one that 2876 was determined for… I know I have it somewhere but I am lazy remember…
Showing Solution at 2876i … this is the timestep you stopped it at correct?
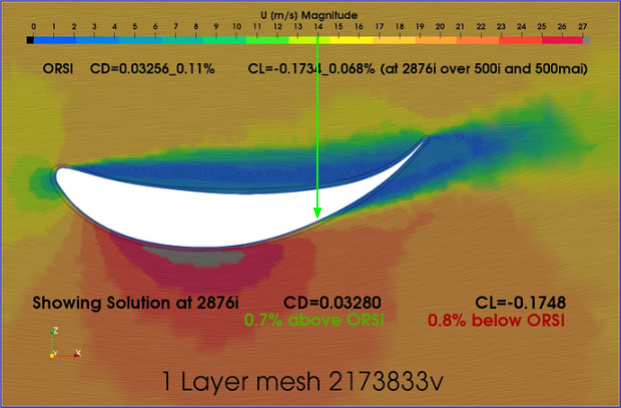
Aw, from my project… I will find that by looking for my 1 layer sim that starts with ‘2173883v’ and report back…
That looks like you can stop it even before 500i, here is ORSI 500i500ma:
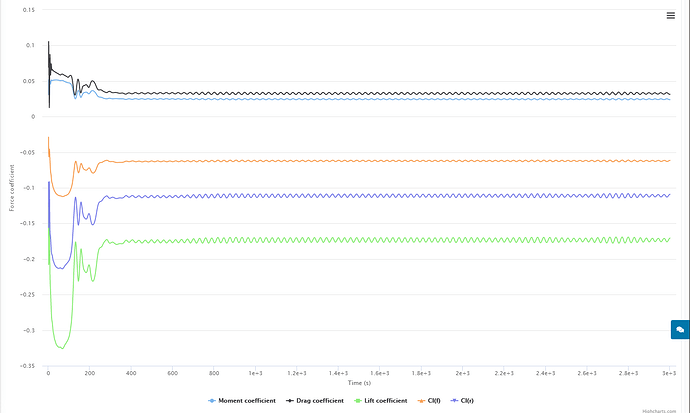
And the SimScale plot shows maybe in the 300i area for quick testing:
FOR more thorough test you have to go to 3000, then find an iteration before 3000 that matches ORSI, then run another to stop at THAT EXACT iteration… That was my TRICK to get ORSI and last iteration values to be very near each other…
I am finding with results that have LARGE oscillations, the moving average filter iterations should be set very high, I am using 1500ma iterations for the 0 layer test…
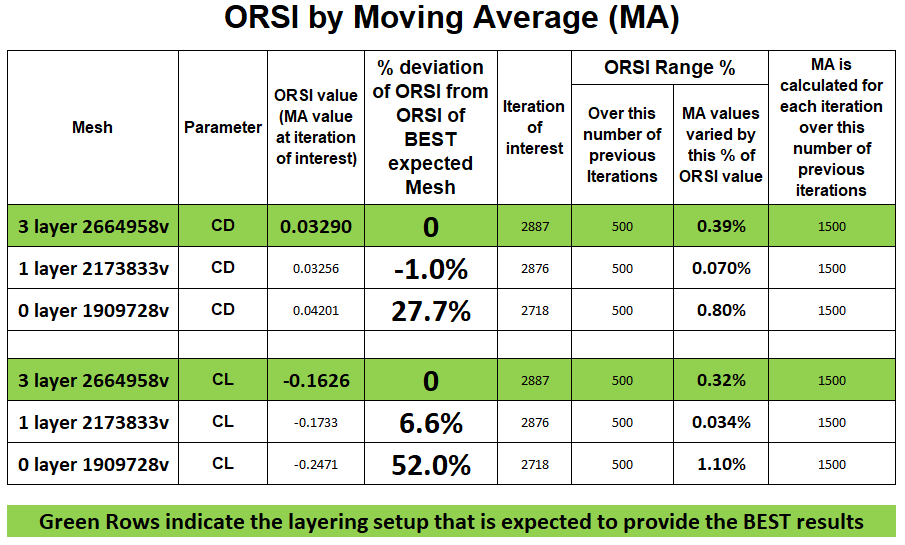
So i understand if im reading yor ORSI right or not, it looks like the top green box says 0.03257_1.0% at 1291i would this mean i should stop at 1291 for your tests?

the bottom also shows this. this i assume means the start of 1% stable (green line)
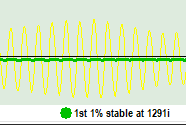
Edit i see this is where the 1% starts so i need to pick a point after this
What is the Moving average filter iterations? is this within your ORSI program?
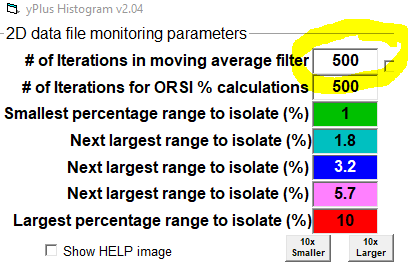
For quick test, you can stop early just by using the Quick approach I just showed…
For through test where you want to have final iteration results match ORSI values at the last iteration, you have to look at the ORSI at last iteration:
.
.
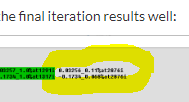
ah ok so
- do the simulation to a full value say 500.
- run the same sim again using the last iteration that match ORSI as the write interval value. For example this could be iteration 487.
- Run all remaining sims with write interval and end time at 487
Correct?
That works as long as last iteration at 487 continues to matches ORSI at 487 (if you want to look at interim solution set plots and yPlus))…
But at the end, you need to do a the same process at low ORSI % 500i and a large enough moving average iterations that get rid of the oscillations…
EDIT: Also, the reason you only go to 500 in the first place is because you had previously made a long run that showed that 500 was already in the stable oscillating range as shown here…
AND actually, the 500 stage could be skipped too if you could see that at 487 the result matched the long iteration ORSI 500i large moving average iterations value…
It comes down to, at some point in time, you will have to do 2 (maybe 3) long iteration runs before you can hang your hat on having the solvers best guess data at the last iteration and at the ORSI you want at that last iteration…
I am going to keep presenting all results of my 01357 layer testing, in this topic, as the results come in…
First I easily created a 1909728v 0 layer mesh with the exact mesh setup as 1 and 3 layer meshes… This should give a valid comparison of 0 vs 1 vs 3 layers…
Here is the ORSI values for that 2718 iteration run:
NOTE: Because the oscillations in the raw YELLOW result data from the solver log varied about 20% through just a single cycle in the last 500 iterations, I had to use a Moving Average iterations of 1500 in order to acceptably filter out the oscillations…
If we set the Moving Average iterations to 2, we can see that ~20% data range in this ORSI plot:
In any case, before I start having 3 and more images to cycle through to show the flow pattern changes between the various number of layers that I end up analyzing , I will simply look at the ORSI results for them in a table…
Here is the table so far for 0 vs 1 vs 3 layers:
.
.
So, when you consider how much of a difference in results there is when only a Single layer is added, I think 1 layer layering is back in the picture…
And according to my preliminary 5 layer mesh I think 1 layer be may even be more ‘in the game’ when I present that new table with a 5 layer mesh added (the 5 layer mesh should be expected to give better results than the 3 layer mesh, if I do it right)…
But to do a good 5 layer mesh on the geometry, I have to change the geometry a little and the refinements a little, so I will have to redo the whole series of meshes with the new geometry and refinements to have a valid table, but I think that is worthwhile here ![]()
I think what is mainly happening here lately is that we are developing a way to analyse the sim results such that we are presenting results that most closely represent the ‘best guess’ of the solvers given our potentially flawed input to them …
We have also tried to layer and simulate your geometry in a way that the solvers ‘best guess’, is ‘possibly’ close to what the real world results would be, if we could even measure them…
So I think there are two distinctly different educational threads occurring here ![]()
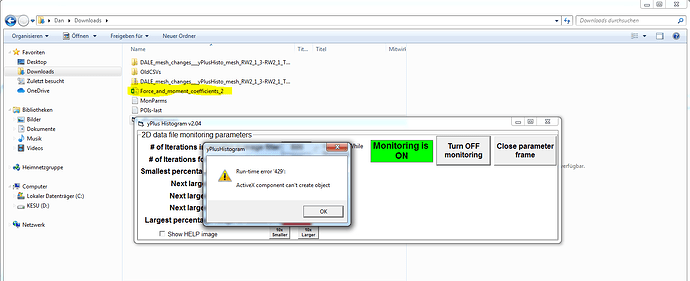
this is indeed getting crazy. I wish i was up to speed on how to use and your ORSI effectively. I had the Y+Histogram file in my downloads folder but i dont think it connected to the sim outputs. Can i used ORSI after the sim is run or does it have to be done while the simulation is running?
Yes after OK too, are there CSVs in your downloads dir and does the button go green when you click on ‘Begin monitoring’?
Do i have to make the Y+ histogram plot first? as in extract the CSV data in paraview? Can i change where the file looks, as in not the downloads directory but where i saved my FOAM.data file?
PS here is the results from the 3.2mm 1 layer test
Very nice (except for 8-20 (will be interesting to see the ORSI difference))…
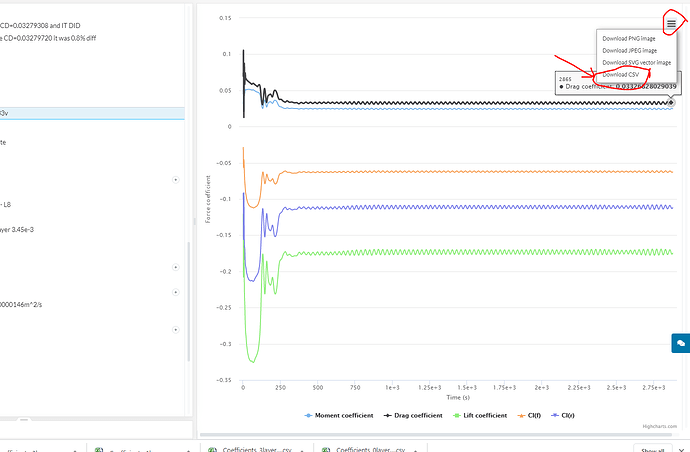
Click on red ‘Monitor incoming plot data’ button and then the ‘Begin monitoring’ button that appears…
Then, on any plot in SimScale click on download csv…
Why do you NOT want to use 3.4mm 1st layer?

