Hello,
I am running different simulations regarding vehicle platooning and im getting negative Cd values for the leading vehicle in some of them. I went over the settings but I could not spot the mistake. I would really appreciate if someone could explain to me why am I getting a negative Cd value.
Here is the link to my project: SimScale
The simulations were I find this issue are: Ahmed body-GTS-0.25L NEW
Ahmed body-GTS-0.3L
If it is of any help, I first tried to run the same geometry in the simulation called Ahmed body-GTS-0.25L but the solution diverged. I reached for help here: Problem with flow speed.
My issue was not entirely resolved so I tried to create the geometry again in SolidWorks and create a new simulation for it, which instead of diverging this time it gave the negative Cd value that I exposed in this post
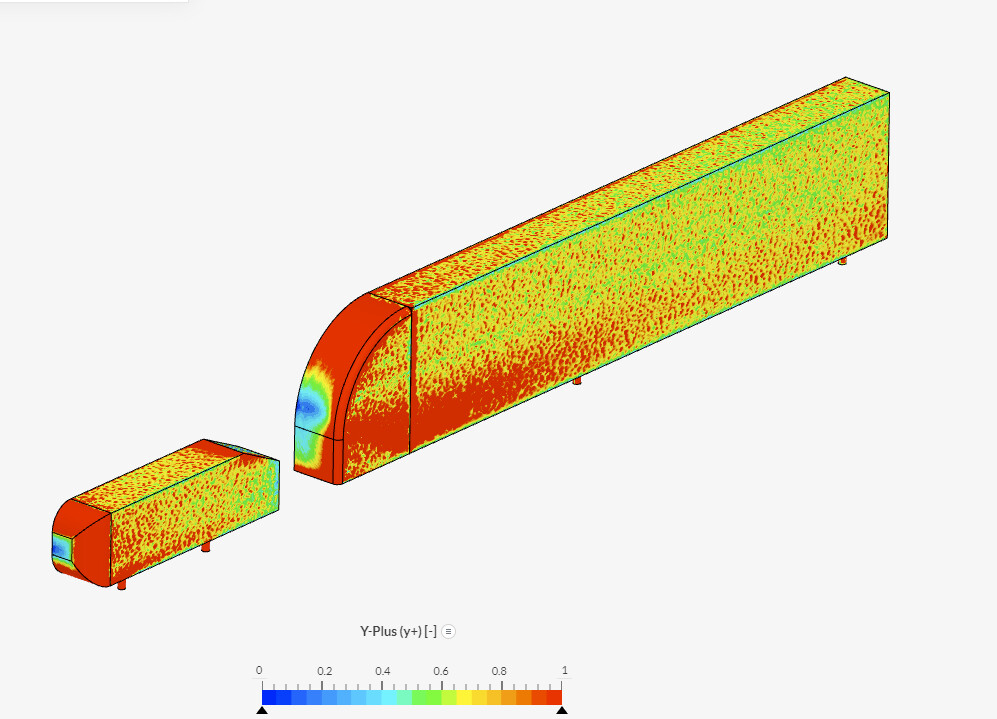
I do not really think that using full resolution walls with y+ > 1.0 would render negative drag coefficients. It will just mean that the shear stress along the wall is not well calculated, but remember that such bodies, pressure is the main factor behind drag.
To me, it looks like an error in the setup/direction/I/O of the drag/lift forces as the lift should be near 0 and the drag should be around 0.45 as you obtained in other simulations., but you are obtaining completely the opposite. It looks like the results are scrambled. I would start the case again from 0. I could not find any other logical explanation. Clearly, a positive pressure is built in the leading edge of the rear body, but that pressure cannot be greater than the pressure in the leading edge of the lead body.
Following what you wrote, it makes no sense that the same simulation diverged in the first try and then converged. Maybe you are not replicating well your other cases?
Some additional advice:
-The pressure residuals are very high (1e-2), but I do not think that caused the issue.
-For such high residuals to converge you need to switch to a transient simulation.
No, I mean to set up the case again, using the same geometry (but with a new case name). Could you briefly tell me what is different from case to case? You have like 25 cases. What are you switching from one to another? I was in a rush but they all looked very similar.
Basically, each case is a different geometry.
I am trying to simulate several vehicle platooning sequences using the Ahmed body and GTS vehicle models with different separation distances. Every case has the exact same simulation settings (I just use the duplicate option everytime I am creating a new case).
The problem seems to appear in the cases when the Ahmed body is the leading vehicle and the GTS model is the trailing vehicle and they are separated by a small distance (0.3L and 0.25L cases both gave negative Cd values for the leaading vehcile while everything seemed fine for the 0.5L case).
At which velocity do you want to have the cars running? As or right now it’s set to 60m/s = 216 kph.
In that regard, and this is just a theory, I can imagine that the drag of a leading car can be reduced, since the stagnation pressure of the following car, is increasing the pressure behind the leading car and therefore reducing the overall drag of the leading car.
For the case of the truck, I can imagine that with the stagnation pressure of the truck being that high and the truck being that close to the leading car, a negative drag coefficient can occur.
What I would try to see is when you increase the distance of the trailing vehicle, if the drag coefficients behaves accordingly.
Yes, the velocity I am using for all my simulations is of 60m/s.
I have already tried to increase the separation distance of the trailing vehicle, in the case of Ahmed body-GTS-0.5L, and the Cd values for both vehicles seemed fine. It is just that at smaller separation distances (cases Ahmed body-GTS-0.25L & Ahmed body-GTS-0.3L) is when the Cd becomes negative only for the leading vehicle, which is the Ahmed body.
Okay, so my guess really is that this is indeed a true physical phenomenon.
Please have a look at the paper I provided before which shows the same effect of drag reduction for leading vehicles. I can truly imagine that this effect can reduce the drag so much that the drag coefficient of the leading vehicle becomes negative.
Nevertheless, the things @jairogut and @ggiraldof recommended in terms of CFD still apply.
I did have a look at the paper you provided but I did not quite understand it… It shows that the leading vehicles in platooning sequences tend to have a much lower drag reduction than trailing vehicles, while in the contrary many other papers and the simulations that I have run myself show that the biggest drag reduction occurs in the leading vehicle. Maybe it has to do with that your paper focuses on Yaw Averaged Aerodynamic Drag instead of pressure drag?
Also do you think it is really possible that this is a true physical phenomenon? I thought that a negative Cd value for a vheicle simulation indicated that there must be something wrong with it since it was an impossible result…
The case in Figure 7 in the research paper is a case for the drag reduction for yaw of 0 deg, therefore fitting to your research.
Let me try to describe it like this.
For any vehicle, you have a high-pressure region at the front and a low-pressure region behind the car, which creates the main part of the drag. So the drag is the pressure difference of Pfront-Pback ( we don’t take drag due to friction into account for now)
Now a trailing vehicle is approaching the leading vehicle, meaning that the high-pressure region of the trailing car increases the pressure of the low-pressure region of the leading car. This leads to a reduction of drag for the leading car because the pressure difference of the leading car is reduced. ( this can be seen in Figures 6-7 of the research paper and also in the simulations you have done for the trailing Ahmed bodys.)
Imagining now that the high-pressure region of the trailing vehicle is higher than the high-pressure region of the leading vehicle, the pressure difference for the leading vehicle Pfront - Pback would now be negative. For a truck, the high-pressure region is pretty huge so I can imagine that a negative pressure coefficient for the leading vehicle is possible.
You explained those concepts really good, I think I might understand now a bit more the reason of my results. Thank you very much!
I will keep doing research on this topic for a while, I hope you don´t mind if I reach out to you again if at some point I get confused again.
@SBlock, I also thought about what you mentioned, but for that to happen, the rear pressure should be much greater than the frontal pressure. I completely agree with the reduction of drag due to the increased rear pressure but is large enough to generate negative drag? The only way to prove it is:
Do 2 more runs systematically increasing the distance between the bodies.
Switch to transient simulation. The pressure residual is 1e-2, which is far from satisfactory for a steady-state simulation. Maybe the solved pressure values are unrealistic and hence affecting to a great extent the results.
Still, that does not explain the large positive lift obtained in the frontal body (is pressure being built below the front body? it did not appear so).
Interesting discussion and I liked the near final explanation from @Sblock
Similar somewhat to the NASCAR slingshot move, but it can also create instability for both cars.