Thanks I now have the Sorribes Palmer et al., 2018 document… ![]()
BUT, I do not see density or viscosity listed there, where did you get that info ![]()
Thanks I now have the Sorribes Palmer et al., 2018 document… ![]()
BUT, I do not see density or viscosity listed there, where did you get that info ![]()
No worries, from memory my Re is not exactly 6 million, however is close. if you are aiming for 6 million Re, and you know the cord length and velocity, you just rearrange to get viscosity, you just need to adjust the velocity and viscosity to match RE 6 million.
Best,
Darren
Are you saying that neither the density nor the viscosity need to match the experimental setup? (I guess there is some sense to that as long as you are a true believer in equal RE means same results, I have always had a mental problem with that but I guess that is the way we have to look at it…)
@DaleKramer true, not that they don’t have to match, but the correct ratios do match, with viscosity, density, length and velocity is the ratio.
Best,
Darren
Any chance you can add to your Post 2, the number of cells in each of the mesh independence study meshes ![]()
Since they are all imported meshes, I have no way of determining general stats like that ![]()
Hi @DaleKramer, yer good point, hopefully I recorded that data originally, otherwise I might have to re-download the meshes again and query them, which I might not get round to doing  I’ll have a look.
Best,
Darren
Pretty please, at least the number cells in the ‘Very Fine’ mesh 
I hope that is the ‘Ver 4’ domain which is my interest…
If not, then what domain is ‘Very Fine’
When you do get around to mapping them all, please provide the Domain name of each…
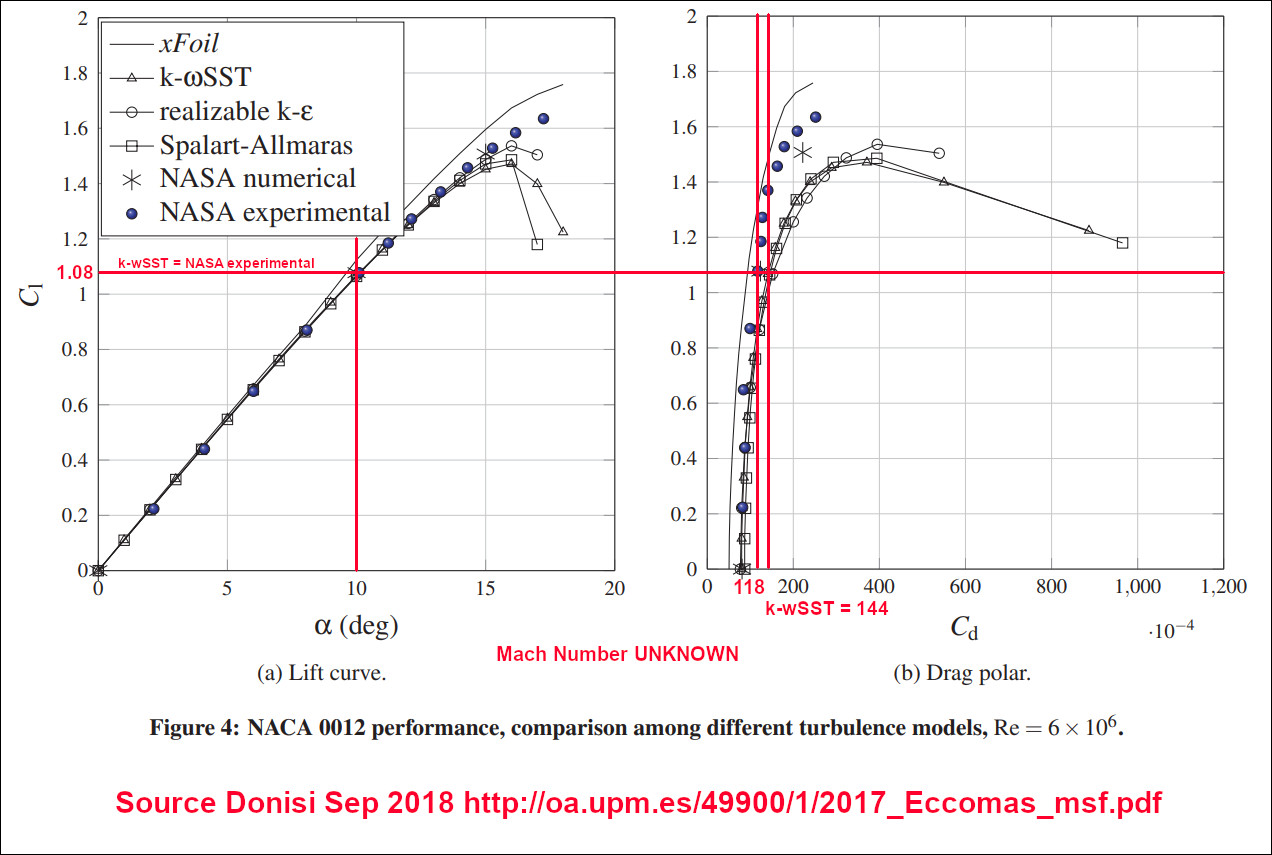
From Sorribes Palmer et al., 2018 document, this is my take on a NASA experimental values extraction (pixel resolution interpolation) for Re 6M and 10aoa on the NACA0012:
Cl = 1.08
Cd = 0.0118
I would like to use that as NASA experimental data which we can use to verify our CFD projects with. (I would much prefer tabulated values vs plot data but I have not found them yet ![]() )
)
Would you agree that I have extracted the correct values from that plot ![]()
Looks about right, I actually have tabulated date of the graph I used an app called graph grabber I think, I can try to find the file if it would help (I archived it).
Best,
Darren
GREAT but I only need this one data point right now at 6M Re and 10aoa…
I that vein, I have taken the time to go through and look at each of the many simulations, all the runs in each, and the results in each (wow, there are many ![]() ). You spent countless hours doing them, good job, I feel the pain
). You spent countless hours doing them, good job, I feel the pain ![]()
Concern #1
You have done the most investigation at 6M Re and 10aoa (my favorite data point too ![]() ).
).
There is only 1 run for a ‘vfine’ mesh in ‘Run 1’ of the simulation ‘AoA10, Av_Yplus_1.24, Wall Fun, vFine’ (I have to assume that is the VeryFine mesh that you used in your ‘Mesh Independence Study’.
The results have excellent stability at the end of the 11,047 iterations and I took the opportunity to quantify the stability of the results by calculating the ORSIs for the CL, CD and CM.
Here is the table of those ORSIs:
The problem is, that none of the three very stable values for CL, CD or CM (stable to <0.02% over 500 iterations) seem to compare to the VeryFine mesh results that you show as being ~0.52% larger than the experimental results.
In fact, the results of ‘Run 1’ of the simulation ‘AoA10, Av_Yplus_1.24, Wall Fun, vFine’ , show this relationship to the experimental data for CL and CD:
CL of ‘Run 1’ is 0.74% larger than experimental CL (that compares reasonably)
CD of ‘Run 1’ is 3.4% smaller than experimental CD (that is somewhat concerning to me ![]() )
)
Concern #2
I see many runs, with the only difference being in the numeric values of each (not counting relaxation factor differences, where I think that a higher factor means better results in the same number of iterations if the sim does not diverge). These runs seem to end up with visually stable results that are quite different from each other. How is one to know which set of numerics should be used in projects that do not have the benefit of experimental results in order to fine tune the numerics to match them ![]()
EDIT: Concern #1 expanded and NEW Values to use for Verification
I just realized that with respect to CD values at Re6M 10aoa, according to Sorribes Palmer et al., 2018 it looks like with k-wSST, we might only expect to get within ~20% of NASA experimental data on the HIGH side, here is why I think that:
On the flip side, for CL values at Re6M 10aoa, it looks like k-wSST can provide full accuracy on the NASA experimental data.
I am, also considering using new Verification values from NASA TM 4074 page 29, simply because the data is confirmed to be at Mach 0.15 so I would use a 2 meter chord airfoil at 43.8 mps and at Standard Sea Level air density and kinematic viscosity (Mach0.15 and Re6M) ![]() :
:
And even with that data for my project, it looks like, according to Sorribes Palmer et al., 2018, I might only expect to get within 20% on the high side of the appropriate experimental CD value ![]() , lets hope I do better
, lets hope I do better ![]()
EDIT: I am thinking of stealing your geometry file ‘For Tet 2’ ![]() , is it made from the revised equations for the NACA 0012 with a sharp trailing edge
, is it made from the revised equations for the NACA 0012 with a sharp trailing edge ![]()
Me too, I reckon with the new tet mesh and more robust layering this can be improved.
Good question, I used the highest relaxation factor that allowed stability (If I remember correctly) this tended to get better results. Recently I have been turning on passive scalars and using the auto relaxation factors, seems to give me guaranteed good results. Feel free to back this up with evidence ![]()
Feel free, I actually wrote a featurescript in onshape that generates my aerofoil geometry automatically, the rounded trailing edge was required due to snappy not being great with sharp edges, should be irrelevant with new tet mesher. However, the only change was literally adding a radius to the same sharp trailing edge so the underlying code wasnt changed. Just FYI there is a geometry operation to make the fluid domain from your geometry called ‘Enclosure’ so you don’t need to do the subtraction manually in CAD, you just provide the aerofoil geometry and then do the enclosure operation.
Best,
Darren
Ah, now I see it, a 2mm thick rounded TE on a 2000mm chord…
I think since I am using TETforCFD mesh, I would like to try the sharp TE, any chance you could make me a 2m chord with 0.192m span geo file in OnShape that uses the new sharp TE formula ![]()
y= ± 0.594689181*[0.298222773sqrt(x) - 0.127125232x - 0.357907906x2 + 0.291984971x3 - 0.105174606*x4]
I’ll check the code, dont really fancy modifying it (I havnt modified it in about 3 years) but I’ll see if it uses the same formula.
Best,
Darren
Thanks, long long ago, in a galaxy far far away, I made an AutoCad script that read any csv file I made for an airfoil, but I haven’t seen an easy way to do the same thing in Rhino 
yt=digits[2](a0(x_Ordinate^0.5)-a1x_Ordinate-a2(x_Ordinate^2)+a3*(x_Ordinate^3)-a4*(x_Ordinate^4));
const a0=1.4845; const a1=0.6300; const a2=1.7580; const a3=1.4215; var a4=0;
if (TE == ‘closed’)
{
a4=0.518;
}
else
{
a4=0.5075;
}
So my script uses the above
So taking digit 2 to be 12% or 0.12, I think its the same?
Darren,
Just for my the sake of my sanity  , do you know of anyone who has successfully used the new TETforCFD meshes for a CFD verification project down to small % deviation from experimental data?
Thanks,
Dale
How are you making your 1 cell wide hex meshes that are imported as ‘uploaded meshes’ and used as domains?