Can I plot wall y+ directly from post-processing?
How to export graph from post-processing? such as U, T?
Thank you in advance
Can I plot wall y+ directly from post-processing?
How to export graph from post-processing? such as U, T?
Thank you in advance
Hi @ktytagong,
You will find y+ in the result control items under field calculations as shown in the image below:
In the case that you add this, you will need to rerun the simulation to obtain the data in that field for post-processing.
Cheers,
Anna
Also you can get data plots and readouts from local ParaView as the answer to the second question 
kind regards,
Darren
Thank you for your answer. Could you please provide me the tutorial to get wall y+?
The problem is I can’t find “field calculations” and I would like to add some graphs on this simulation. It would be great if you can provide me how to add this function.
I am sorry I have tried to look at it and I could not find it.
Thank you in advance
I already downloaded the file from post processing and tried to open with local Paraview and the program could not read it. Maybe I did something wrong. I’ll try again. 
Ah ok, y+ is not available for compressible flows… I think that is what you’re using there? I also find this frustrating maybe we should make a feature request as I’m sure this made topic of conversation previously. @AnnaFless was this not previously available?
As for the downloaded file not being read by paraview, I’m pretty sure this works as I have recently done it. Make sure your reading the case file withing the downloaded folder.
Kind regards,
Darren
“y+ is not available for compressible flows” I am not really sure at this point why it is not available for compressible flows (feature of simscale?).
Moreover, my result is quite weird. The initial velocity is 0.15 m/s but the maximum velocity after simulation is up to 340 m/s. (I can’t comment this one because I havent seen wall y+ yet)
@ktytagong, yer y+ not being available for compressible is no fault of yours. More likely not yet implemented. as for the velocity obscurity, if you share your project here I could take a look for you?
Kind regards,
Darren
here is my link and (k-ep 0.15)
Thank you very much
It seems that this is a convective heat transfer analysis - but indeed you are correct that the y+ field is not available. Maybe @gholami can comment further on this.
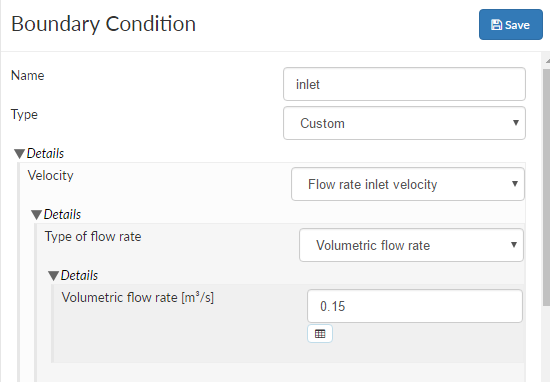
Regarding your inlet velocity, it appears that you are using a volumetric flow rate so .15 m3/s (or were you intending this to be an inlet velocity of .15 m/s?) :

When you download the result from SimScale, you need to open the case.foam file in ParaView and click Apply - then you should be able to see the preliminary results.
This image is done using the clip filter. The 340 m/s speeds are misleading - once I rescaled the magnitude it’s more in the range of 60 - 70 m/s which still seems to fast but this could be stemming from the inlet condition .
Have you seen this tutorial from our “Air-Conditioning and Ventilation Workshop”? Think it might be helpful for your application
In addition to what Anna said above, looking at run 0.15 I found that the inlet boundary condition was causing the project not to converge, when I altered it to a standard velocity inlet with vol flow rate I got much better convergence and had lower velocity values. However the high velocity was in the outlet channels, upon inspection the channels were only 2 cells thick, thus causing incorrect poor results in that area, I would say the minimum you need is 3 however 5 or 7 is better… If the channels are walls then adding layers in the mesh will help.
Kind regards,
Darren
@1318980 @AnnaFless I have one more question about the residual graph.
I have been simulating this projects several times and I could not achieve the converge at 1e-7.
This is the best one I can get and as you can see that there are a little bit fluctuated of pressure then I extended time up to 10000.
it seems like it can’t be stable at the end.
Im wondering that it’s normal to get these kind of residual graphs?
Because I have been through your tutorials and most of your tutorial also can’t get stable residual and importantly no tutorial can achieve 1e-7.
for example: SimScale
Thank you for your kind advice
Converging to 1e-7 is possible, however, most of the time I find convergence to 1e-5 is sufficient to get stable results. To determine if the results are stable you will need to define a result control item and use the plot to determine if it is steady.
In the case above it might be possible to get better convergence to dampen the variable that is oscillating.
Kind regards,
Darren