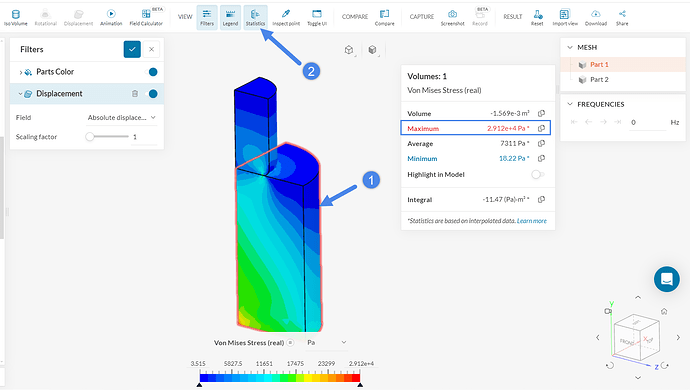
For harmonic analysis in ANSYS for an assembly, we can select the entire assembly, ANSYS then plots a frequency response graph showing the maximum stress in the whole assembly at a particular frequency.
I was wondering if there is an option to select the entire assembly for the frequency response graph in SimScale, rather than focusing on a single point.
Thanks
