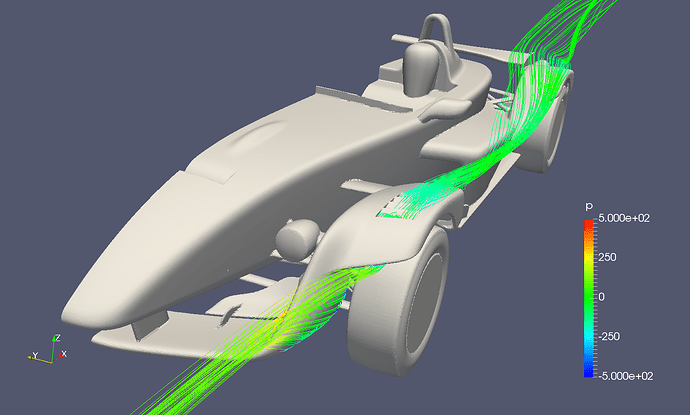
fp-023c - Front Aero Device Study
Contents
- Introductions
- Car
- Model
- Conditions
- Aim of the simulation
- Summary of simulation “fp-023b - Front Aero Devices”
- Simulations
- Front Fender Louvers
- Front Fender Stay (Part 1)
- Front Fender Stay (Part 2)
- S-Duct B
- Front Fender Louver C + Louver Stay B
- Ride Height Comparison
- Conclusion
Introductions
Car
This car project is my formula style 2-seater car project published in GitHub.
I designed the car in the style of the early 2000s formula cars. The reason it’s a “2-seater” is to allow you to share the joy of riding in a formula car with your friends on the road, it is not only for competition on racing circuits.
The prefix “fp” are the initials of “formula-ppoino”. “-ppoino” is a Japanese expression that means “thing(s) looks/sounds/drives like -”, so “formula-ppoino” means it “looks like a formula car”.
Model
I designed the car using the modelling software Rhinoceros.
To import multiple faces, the body, front wheels and rear wheels into one geometry, I exported ASCII STL files of each faces from Rhinoceros and edited the names of the solids in these ASCII STL files manually. Then I put these STL files together into the one STL file using “cat” command and uploaded it.
The size of the mesh required is at least 9M nodes in this case. It was derived from the result of the simulations in "fp-023b Test-C fp-023b Test-C by yosukegb4 | SimScale ".
Conditions
The conditions of the simulations are in accordance with the state of the car running on public roads.
- Inlet velocity, Moving floor speed : 30 m/s (= 108 km/h)
- Ride height : Front: 110mm / Rear: 110mm (basically)
Aim of the simulations
Generally, during aerodynamic development of racing cars, you mainly focus on the characteristics below.
- Downforce, Drag, L/D
- Balance of the front and rear downforces
- Sensitivity of the Downforce and Balance to the vehicle ride heights
Through simulation, as in "fp-023b Test-C fp-023b Test-C by yosukegb4 | SimScale ",
I found there was insufficient front downforce. It depends on the car weight balance and how the vehicle ride heights change, but I provisionaly set a goal to distribute the front and rear downforces of the body to be about 60-65%. ( Clf : Clr = 40-35 : 60-65 )
Summary of simulation “fp-023b - Front Aero Devices”
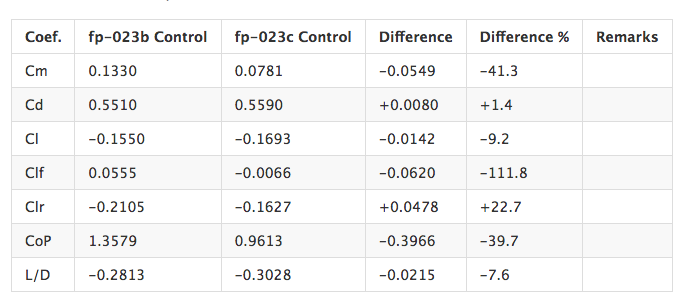
I tested some front aero-devices in the simulation "fp-023b - Front Aero Devices fp-023b - Front Aero Devices by yosukegb4 | SimScale ". The following front aero-devices increased the front downforce effectively. These decreased the aerodynamical front lift to almost zero, but the ratio of front-rear downforce was still 96% on the rear axle.
- S-Duct at Nose Cone
- Front Wing t50 (changed from t40)
- Modified Front Inner Fender
- Front Flap
- Position X+20mm
- Angle +7.5deg (mechanical MAX +15deg)
- Position X+20mm
Coefficients of the Body and Wheels
- fp-023b Control : Base of “fp-023b - Front Aero Devices”
- fp-023c Control : Best result of “fp-023b - Front Aero Devices”
Simulations
Front Fender Louvers
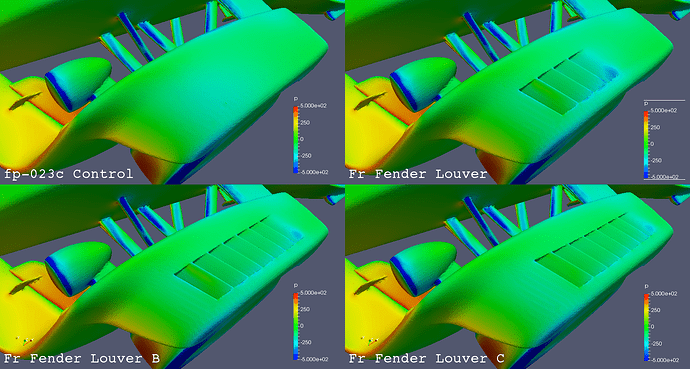
I found a low pressure area on the upper surface of the front fender. It seemed to generate a lift force like a aircraft wing coupled with the high pressure in the wheel house. So I thought that a louver may be effective for eliminating the pressure difference between the upper and lower surfaces of the front fender.
I tested 3 types of louver below in the simulations.
- Fr Fender Louver
- Louver at the low pressure area
- Fr Fender Louver B
- Add 2 slits behind “Fr Fender Louver”
- Fr Fender Louver C
- Remove the foremost slit of “Fr Fender Louver B”, Add 1 slit behind
- Inner wall spread on the lower side
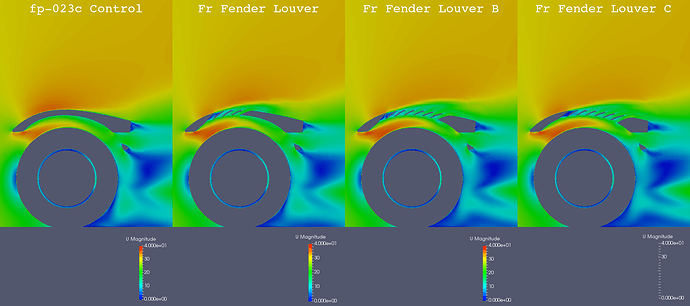
The shapes of these louvers are shown below along with the pressure value from the simulations.
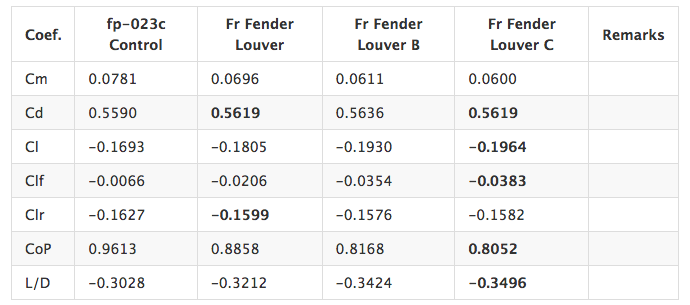
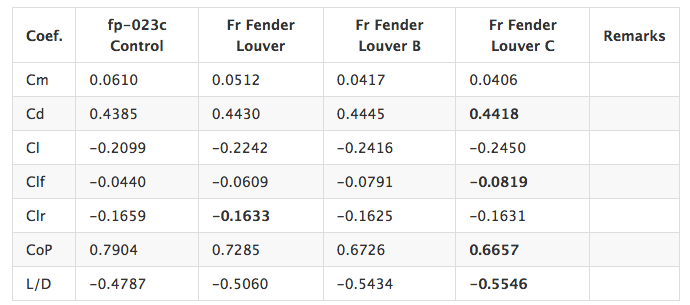
Coefficients comparison
A table comparing the coefficients obtained from the simulation are shown below. As it shows, “Fr Fender Louver C” is most effective with the biggest front downforce and the small drag increase.
Coefficients of the forces on the body and wheels
Coefficients of the forces on the body (without wheels)
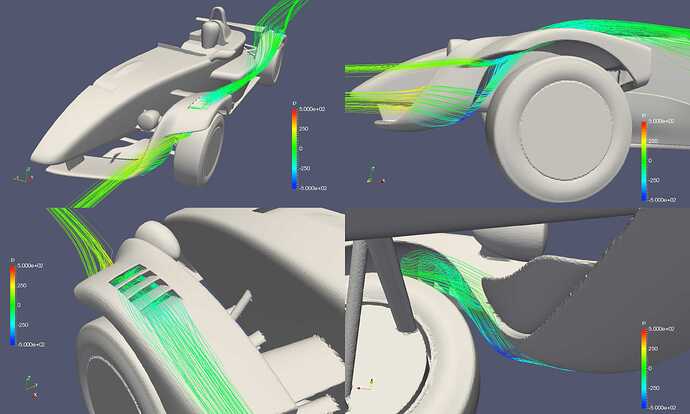
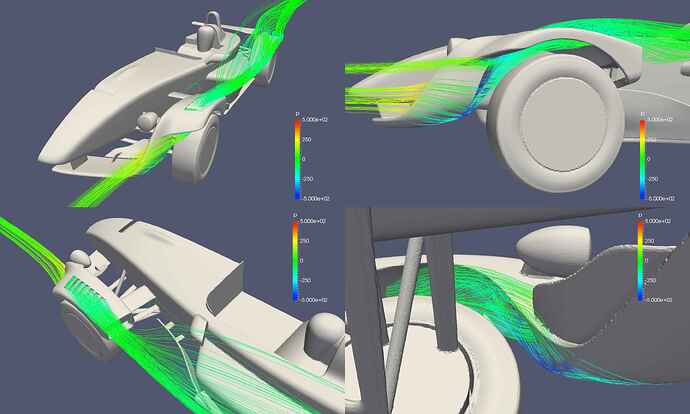
Flow through the louver
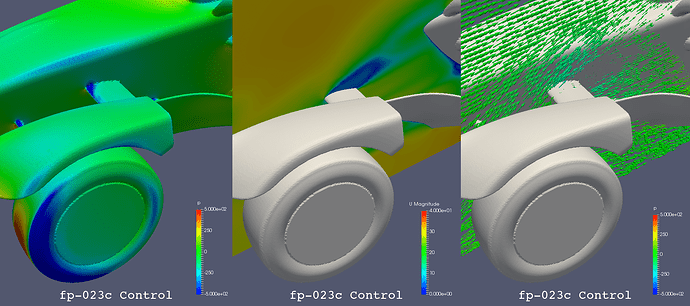
These louvers generate flows from the lower side of front fender to upper as seen in the pictures below.
U Magnitude Comparison at Y=-800mm
Stream Lines - Front Fender Louver
Stream Lines - Front Fender Louver B
Stream Lines - Front Fender Louver C
Front Fender Stay (Part 1)
I found the front fender stay was installed so as to go against the flow and it seemed to generate a lift force. Therefore I designed other stays that do not inhibit the flow.
I tested 2 types of stays below in the simulations.
- Stay - Oval Tubes
- Stay - Louver
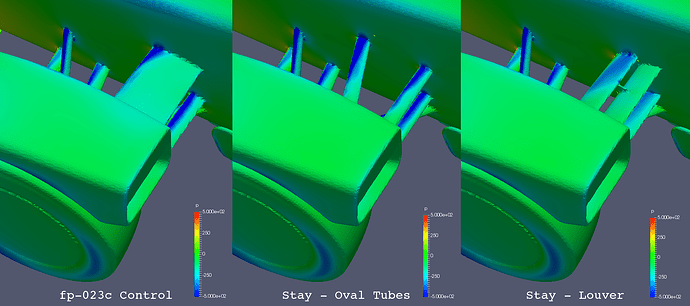
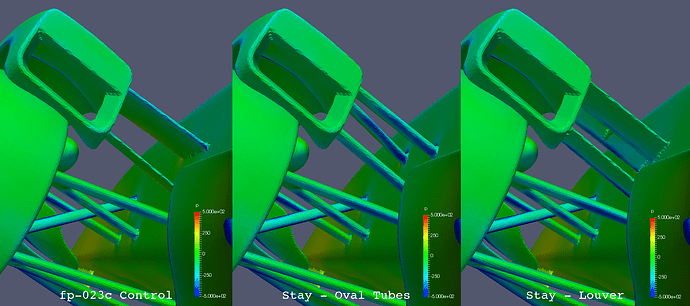
The shapes of these stays are shown below along with the pressure value from the simulations.
Upper View
Lower View
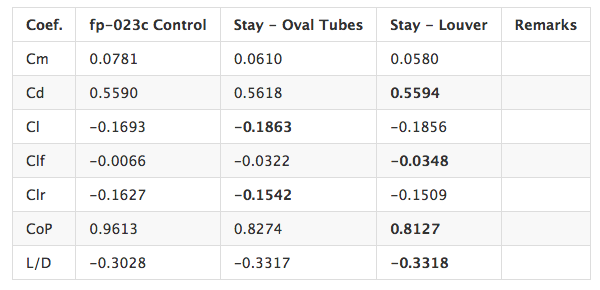
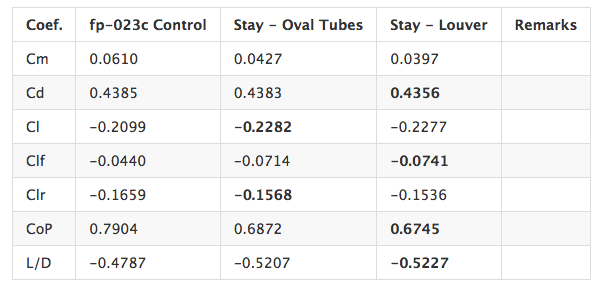
Coefficients comparison
The both new 2 stays increase the front downforce. The “Stay - Louver” is less drag than “Stay - Oval Tubes”.
Coefficients of the forces on the body and wheels
Coefficients of the forces on the body (without wheels)
Flow around the stay
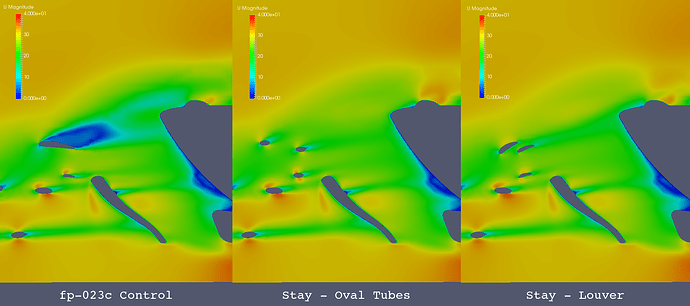
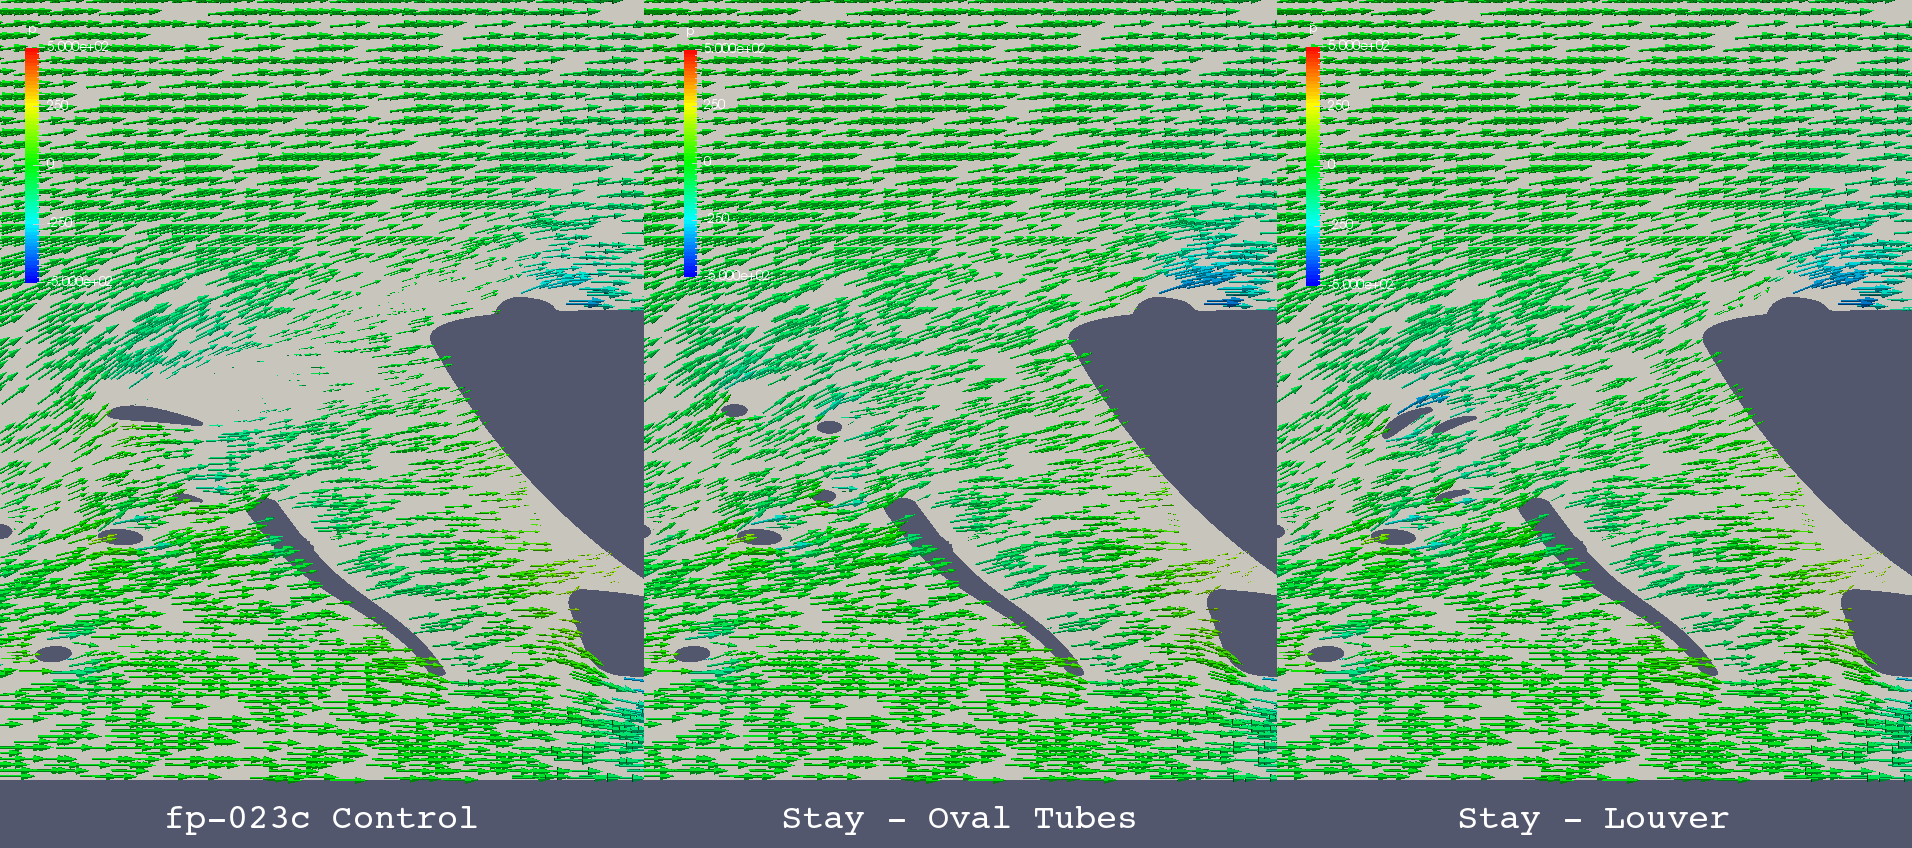
The comparison figures of “U magnitude” and “Flow Vector” are shown below.
The flow of “Stay - Louver” seems smoothest.
U Magnitude Comparison at Y=-520mm
Flow Vector Comparison at Y=-520mm
Front Fender Stay (Part 2)
From the comparison of the flow vector of the front fender stays, I thought a louver type stay could reduce the drag more. Therefore I designed another louver stay “Louver Stay B”.
- Louver Stay B
- The angles of the cross sections are a little closer to the horizontal than “Stay - Louver”.
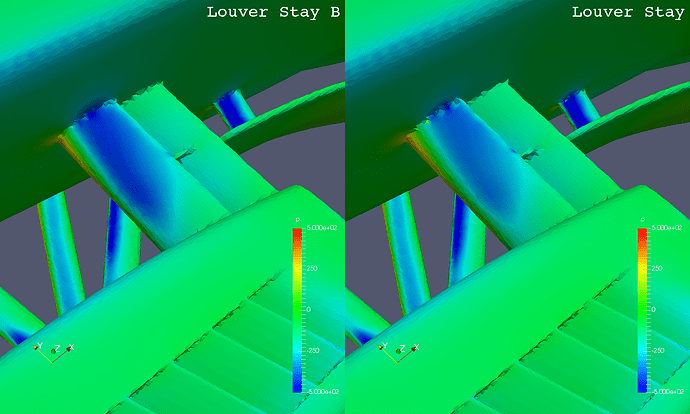
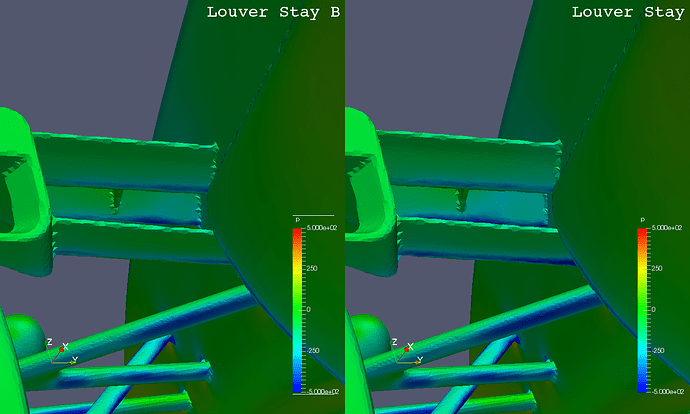
The shapes of “Louver Stay B” is shown below along with the pressure value from the simulations.
( Probably these shapes seem almost the same. / “Louver Stay” = “Stay - Louver”)
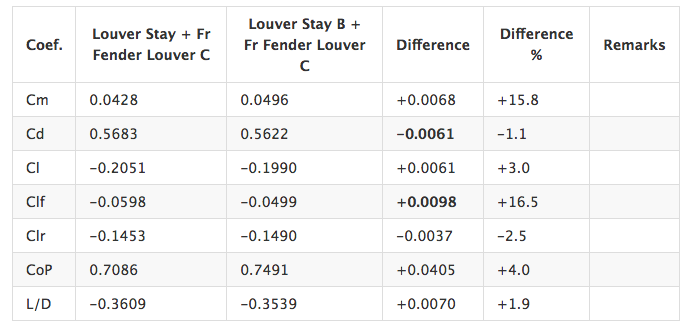
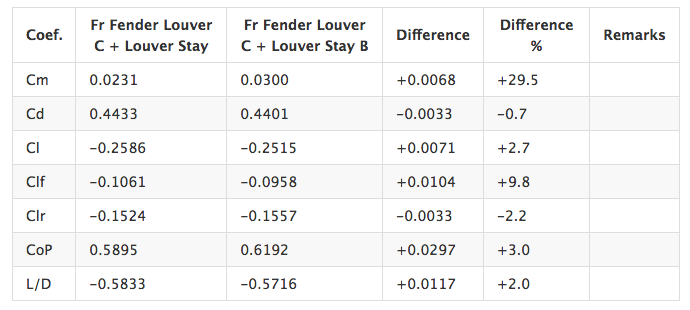
Coefficients comparison
The drag and front downforce of “Louver Stay B” are less than those of “Louver Stay”. But I think these differences are too small to be judged.
Coefficients of the forces on the body and wheels
Coefficients of the forces on the body (without wheels)
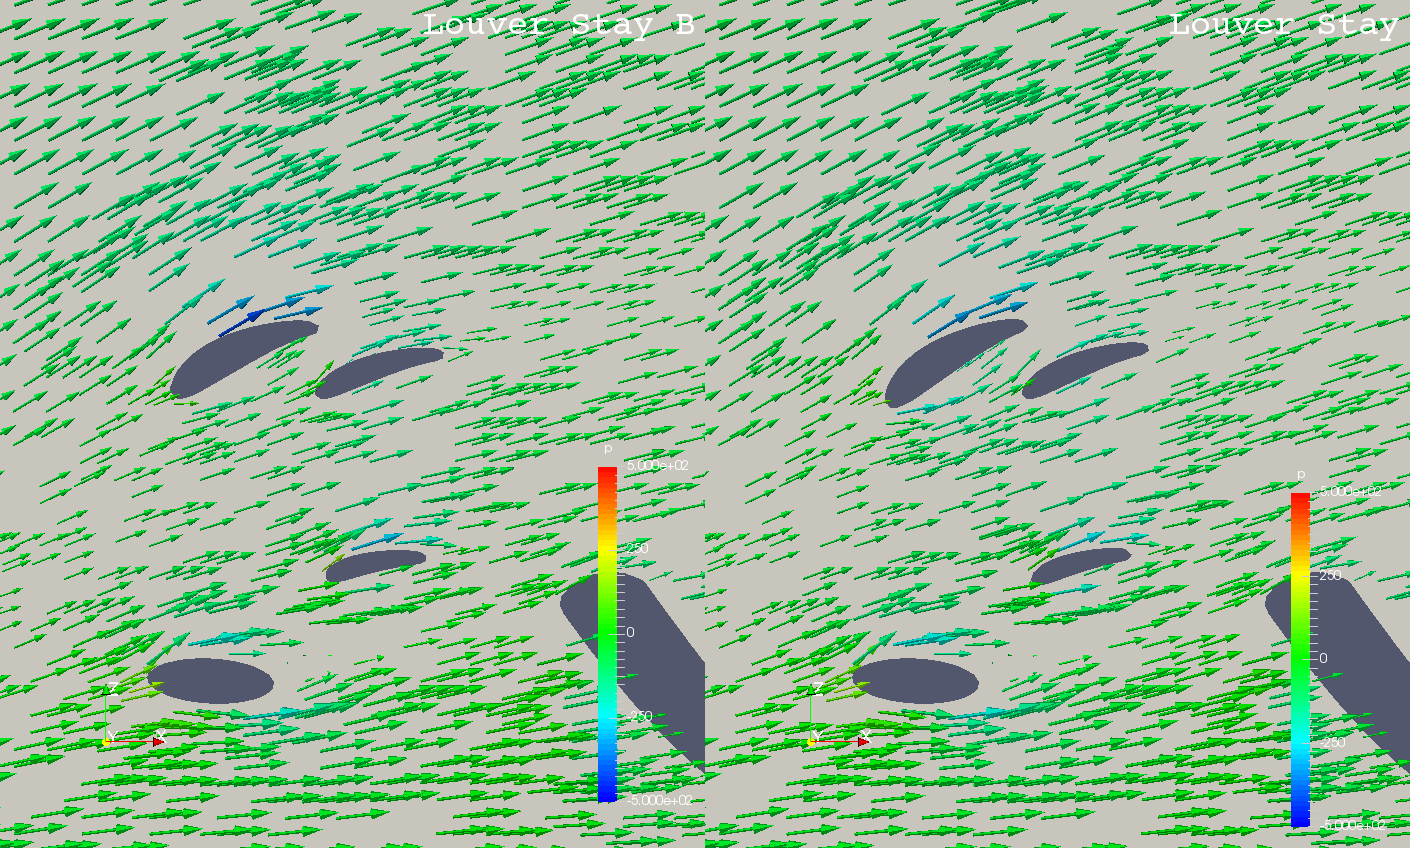
Flow around the stay
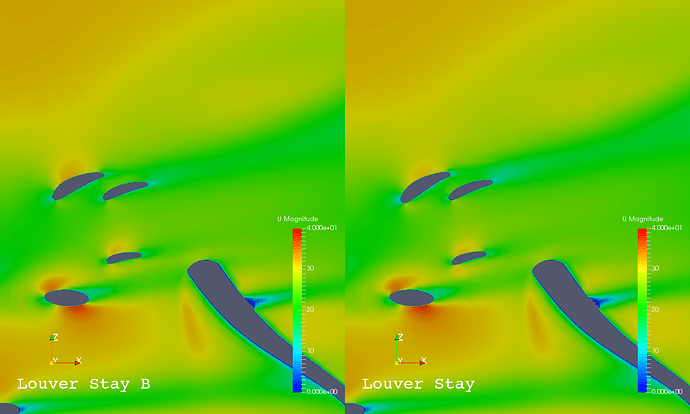
The flow of “Louver Stay B” seems smoother a little than that of “Louver Stay”.
Flow Vector at Y=-520mm
U Magnitude at Y=-520mm
Conclusion of the front fender stay simulations
At this moment, I think “Louver Stay B” is the best for the following reasons.
- Lowest drag
- Smoothest flow → minimize influences on other parts
S-Duct B
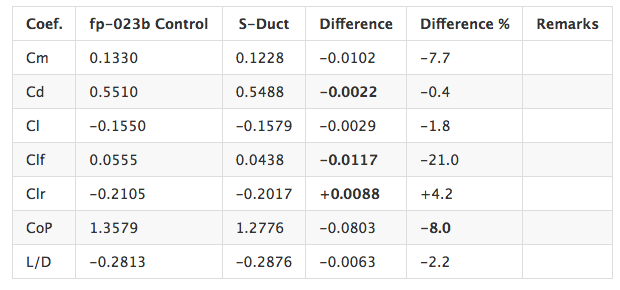
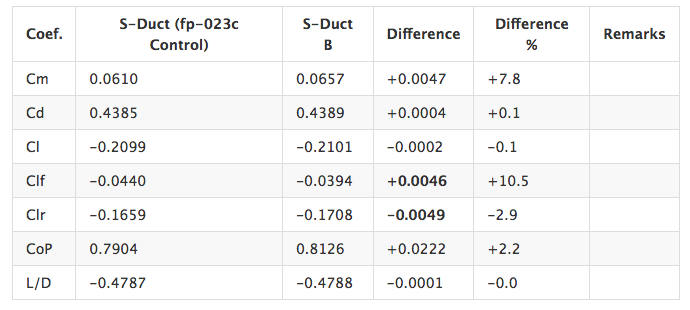
The aero-device “S-Duct” at the nose cone ( simulated in "fp-023b - Front Aero Devices / Simulation - S-Duct : fp-023b - Front Aero Devices by yosukegb4 | SimScale ", the coefficients are shown below ) shifts the rear dowonforce to the front and decreases the drag a little.
Coefficients of the forces on the body and wheels
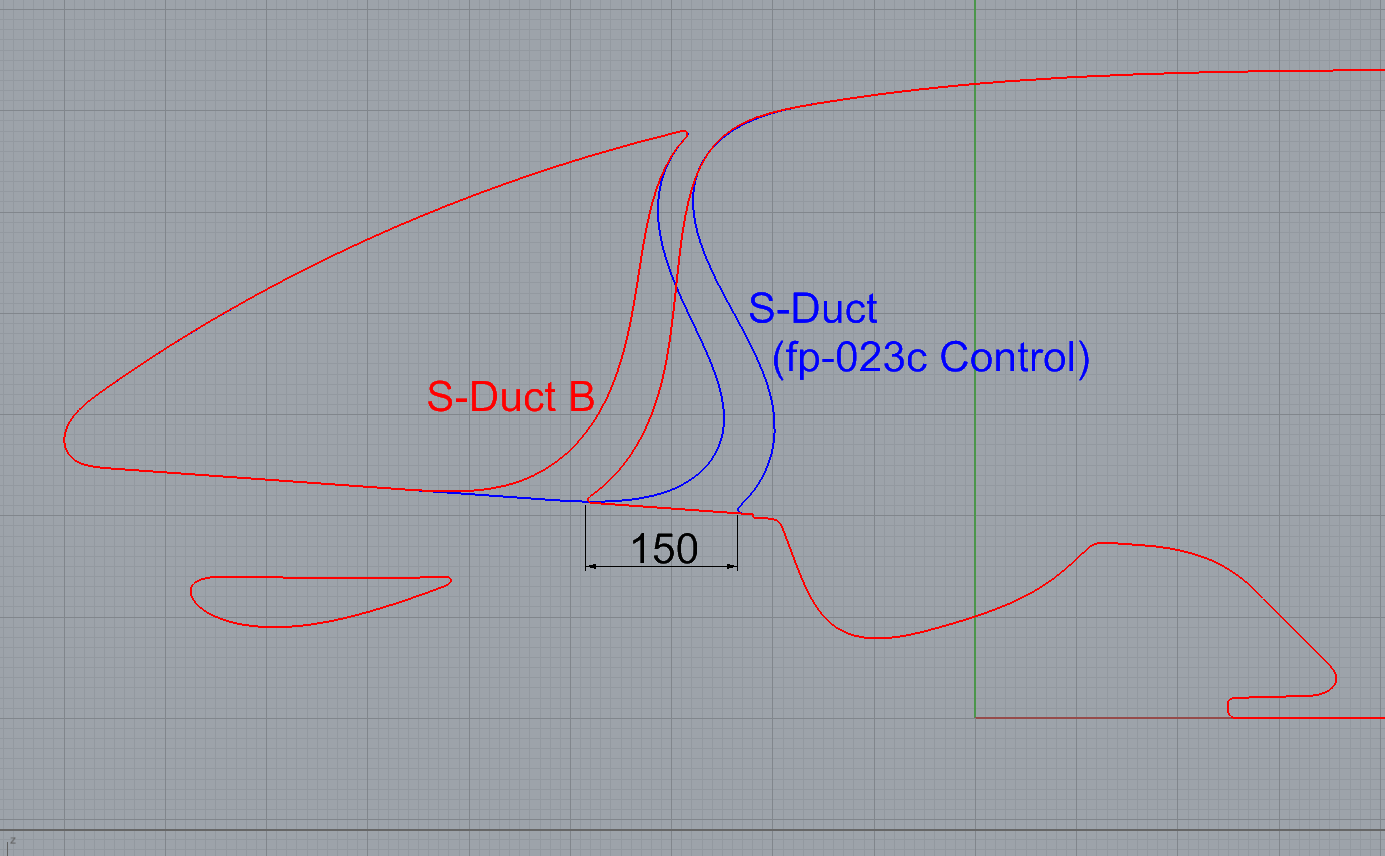
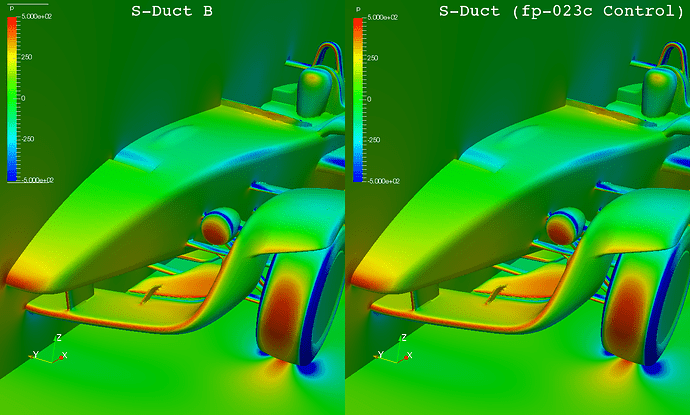
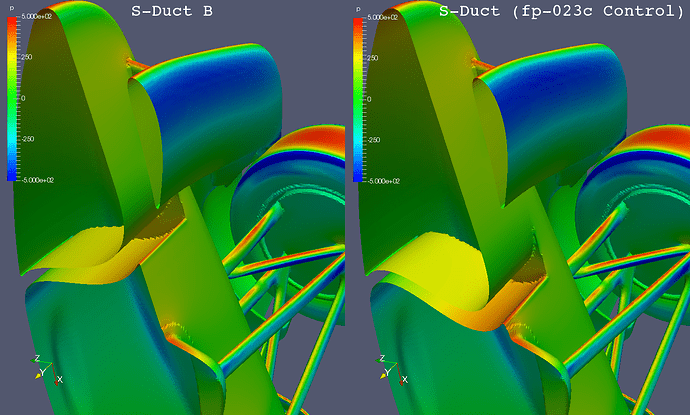
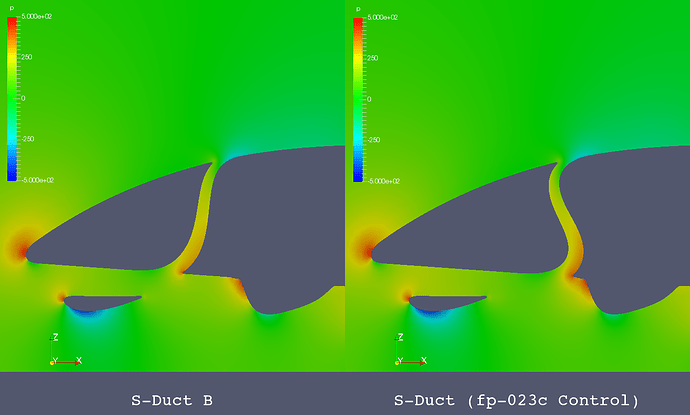
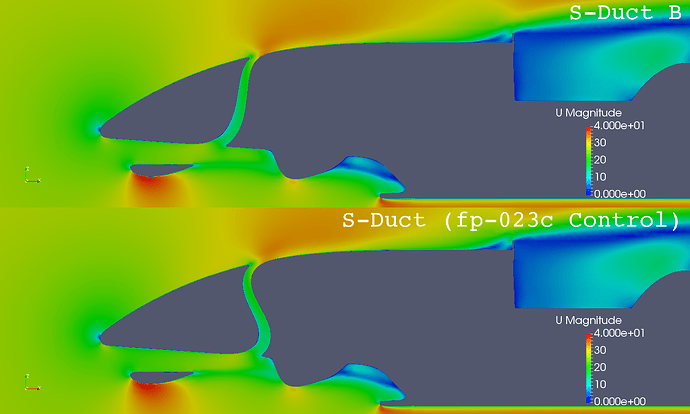
This “S-Duct” was just one case in the simulation of “fp-023b - Front Aero Devices”. Therefore I would like to see the reactivity due to a different design of the S-Duct. I designed “S-Duct B” that inlet is 150mm forward than the original “S-Duct”. The difference is shown below.
Difference between “S-Duct B” and “S-Duct (fp-023c Control)”
Coefficients comparison
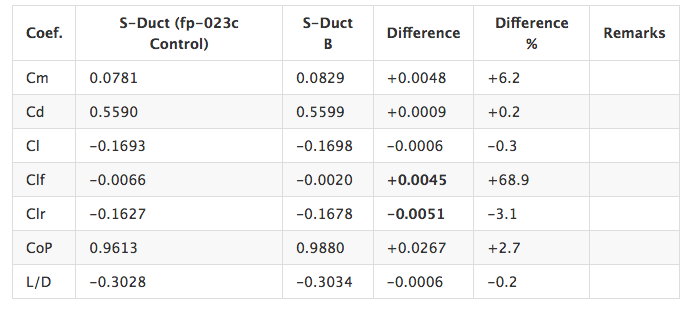
The device “S-Duct B” shifts the front downforce to the rear compared with “S-Duct (fp-023c Control)”. It does not meet the target to distribute the downforce more to the front.
Coefficients of the forces on the body and wheels
Coefficients of the forces on the body (without wheels)
Pressure and U Magnitude comparisons
Surface Pressure
Pressure at Y=0mm
U Magnitude at Y=0mm
Front Fender Louver C + Louver Stay B
The combination of “Front Fender Louver C” and “Louver Stay B” was simulated.
Coefficients comparison
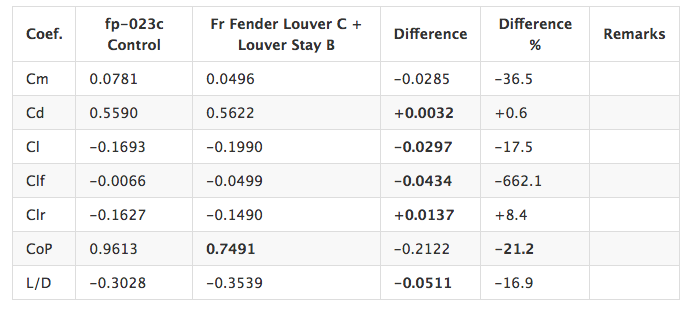
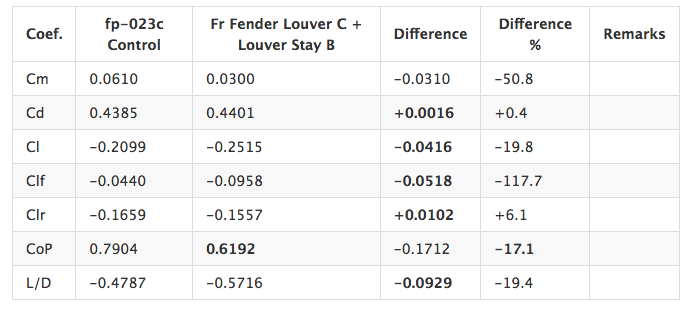
These increase the downforce without much increasing the drag and distribute the downforce to the front more.
Coefficients of the forces on the body and wheels
Coefficients of the forces on the body (without wheels)
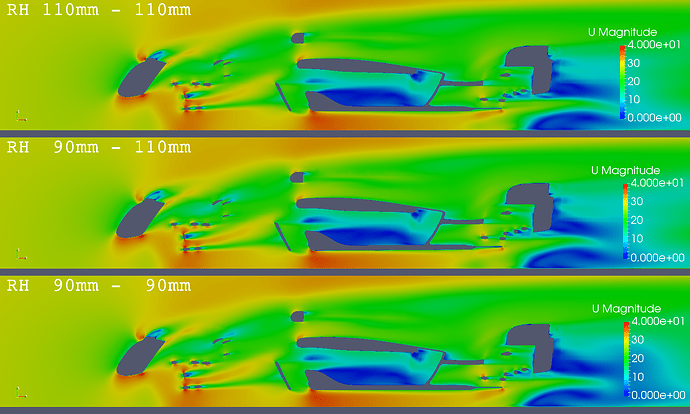
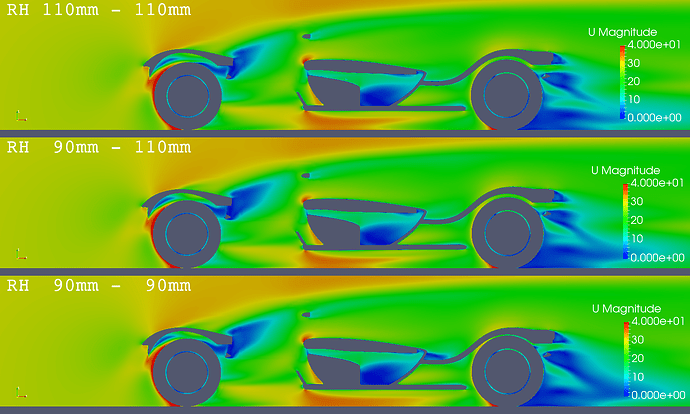
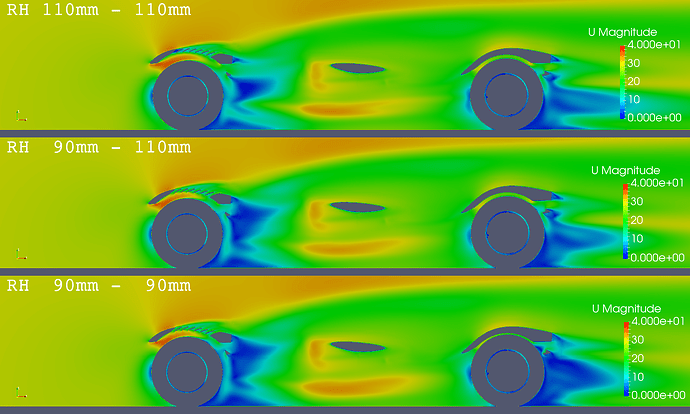
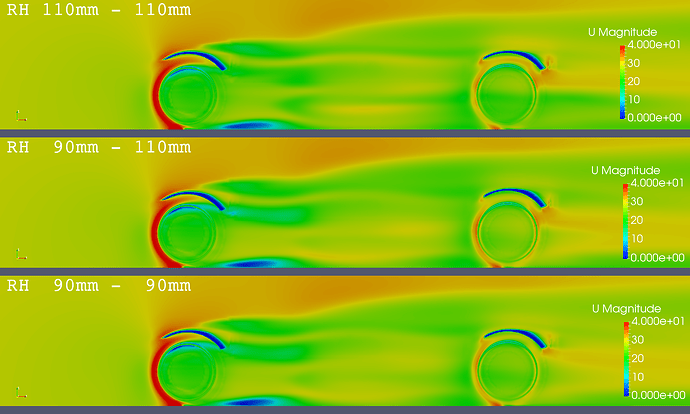
Ride Height Comparison
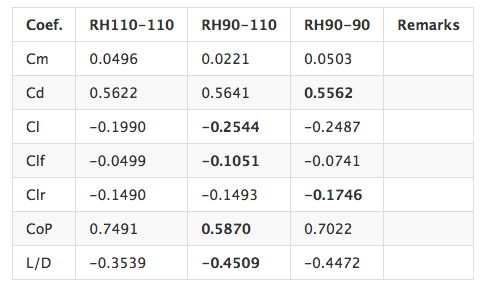
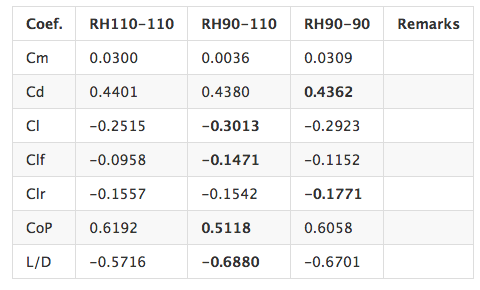
The aero-devices set of the simulations for the ride heights comparison is “fp023c Control + Fr Fender Louver C + Louver Stay B”. The value of “Reference area value [m²]” are the same “0.645” for the all ride height simulations.
Coefficients comparison
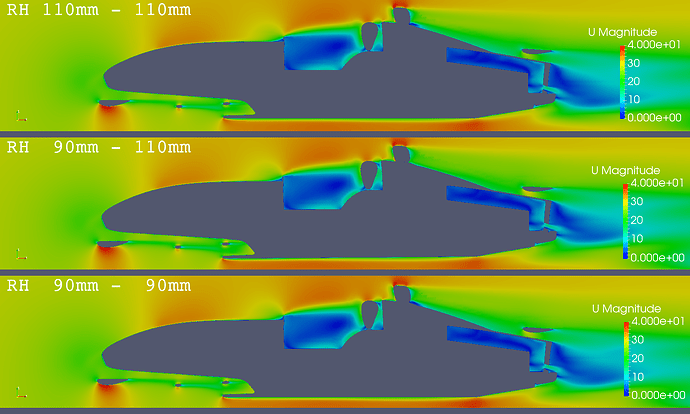
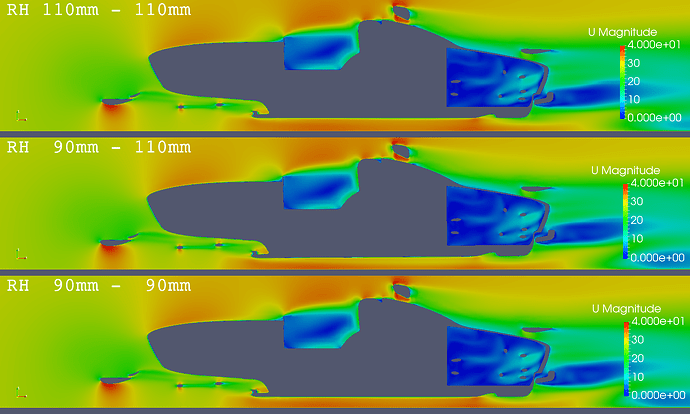
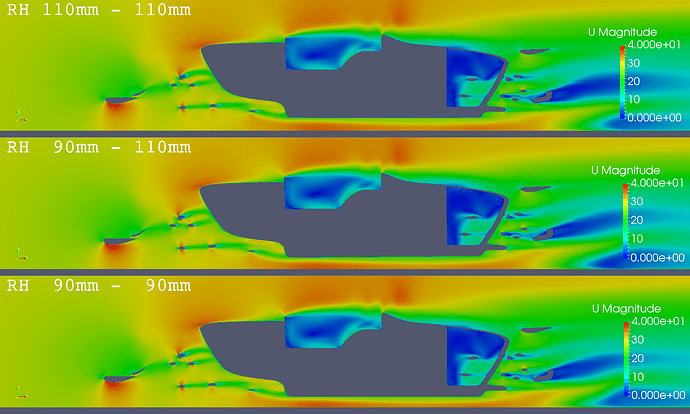
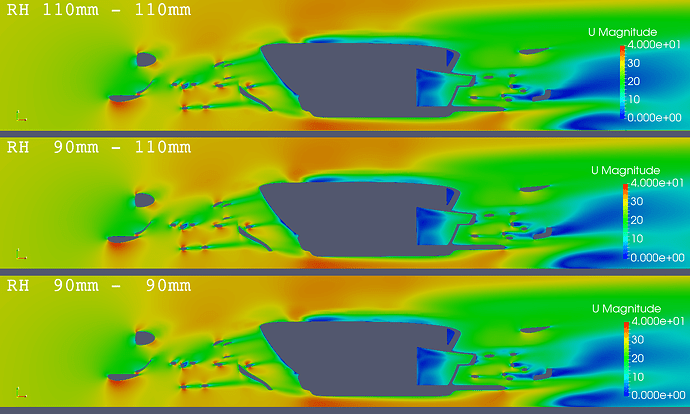
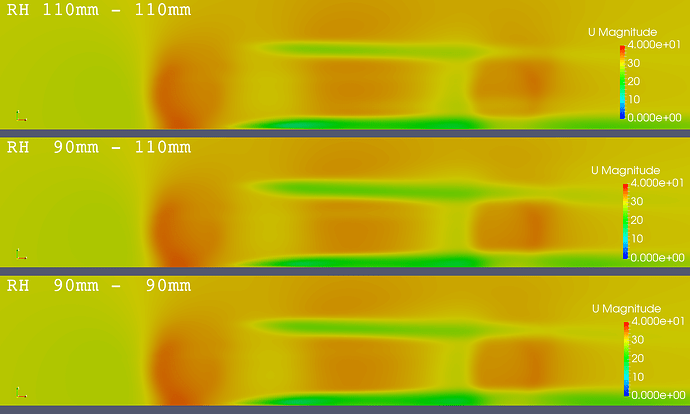
The positive rake angle and the lower ride height make more downforce as same as other general formula cars. And the horizontal attitudes and the lower ride height reduce the drag.
Coefficients of the forces on the body and wheels
Coefficients of the forces on the body (without wheels)
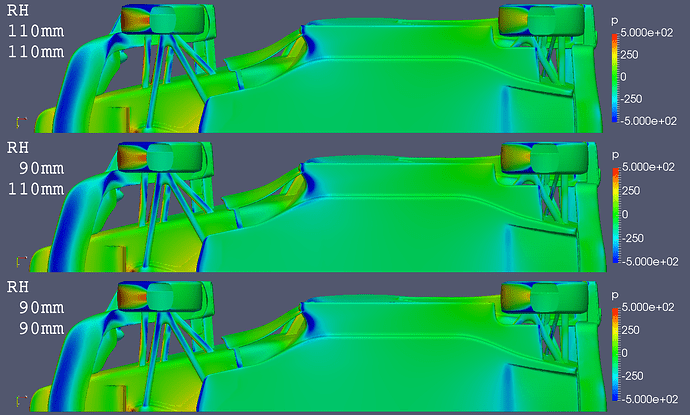
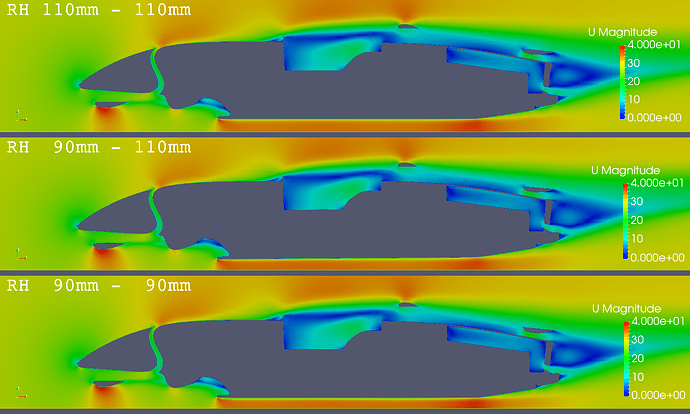
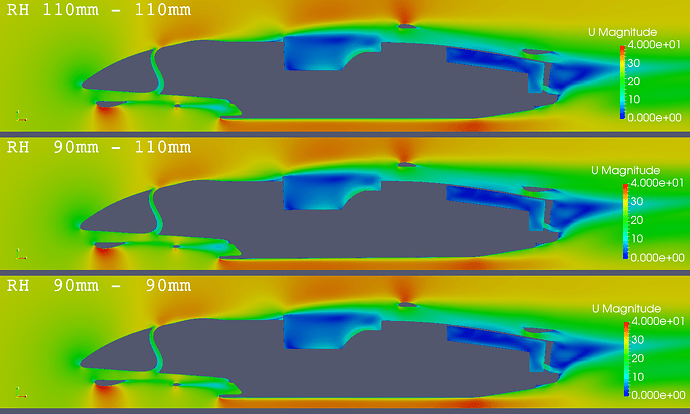
Pressure and U Magnitude Comparisons
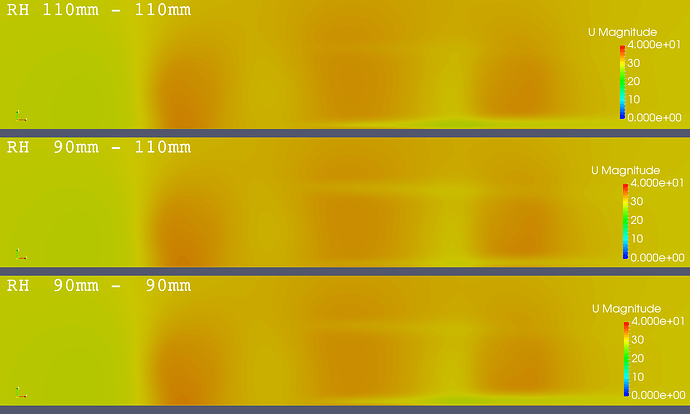
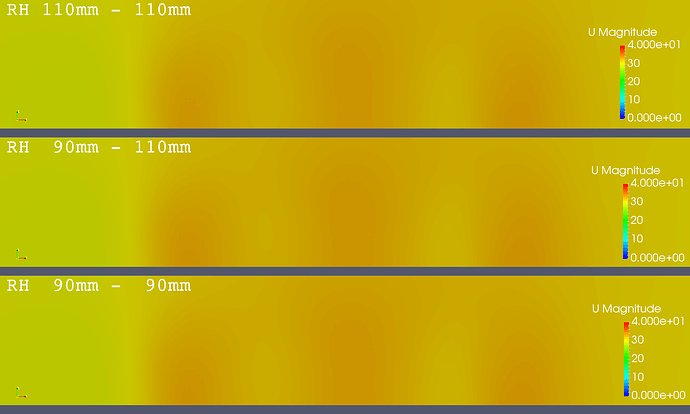
These seem almost the same below, but the differences seen around the edge of the reference plane, on the bottom surfaces of the front wing, between the front fender louver and the front wheel and so on.
Pressure on the body and wheels - Bottom View
U Magnitude at Y=-1mm
U Magnitude at Y=-100mm
U Magnitude at Y=-200mm
U Magnitude at Y=-300mm
U Magnitude at Y=-400mm
U Magnitude at Y=-500mm
U Magnitude at Y=-600mm
U Magnitude at Y=-700mm
U Magnitude at Y=-800mm
U Magnitude at Y=-900mm
U Magnitude at Y=-1000mm
U Magnitude at Y=-1100mm
U Magnitude at Y=-1200mm
Conclusion
As in the results of “Front Fender Louver C + Louver Stay B” and “Ride Height Comparison”, I achieved the goal to distribute the front and rear downforces of the body to be about 60-65%. ( Clf : Clr = 40-35 : 60-65 )
As a next step, I would like to develop the rear aero-devices as shown below and so on.
- Diffuser
- Rear Wing
- Rear Fender
- Rear Bumper
Definitely worthy of the Project Spotlight, thanks for sharing @yosukegb4!
Hi @yosukegb4, Great analysis!
I am more of a structural person so I have a question that is probably pretty basic. I know all of the contour plots came from Simscale but how did you go from these results to the coefficients of the forces on the body and wheels? Does Simscale calculate these?
Thanks!
Christopher
Hi @cjquijano,
Thank you for interested.
These coefficients were calclated in SimScale simulation.
The function is at “Simulation → Result Control → Force and moment coefficients” in SimScale simulation.
When you set result controls, you can get coefficient values in “Solver Log” of Simulation Run like shown below.
forces forces00 output:
sum of forces:
pressure : (191.36126958 -212.379017721 -94.5543844719)
viscous : (17.362086193 -1.03766758448 1.22020061593)
porous : (0 0 0)
sum of moments:
pressure : (92.4888905742 40.5730247486 88.3599140732)
viscous : (-0.397104898237 9.44665486222 11.446518923)
porous : (0 0 0)
forceCoeffs forceCoeffs02 output:
Cm = 0.0309300065483
Cd = 0.436155655602
Cl = -0.292254122391
Cl(f) = -0.115197054647
Cl(r) = -0.177057067744
forceCoeffs forceCoeffs01 output:
Cm = 0.0502949381491
Cd = 0.55616069773
Cl = -0.248696676149
Cl(f) = -0.0740533999252
Cl(r) = -0.174643276223
I copied them and calclated the differences of coefficients using Google Spreadsheet.
Best.
Yosuke Yamamoto
WOW! I am impressed @yosukegb4! Very well done 
Love this project!! Bookmarking this, I’m going to sit down and read it properly later!
Kind regards,
Darren
Thank you! @ahmedhussain18 @1318980
NEXT : Rear Bodywork Study
Looking forward to it @yosukegb4! 
