Hello @mas985, you are right about the issue. I have added an explanation here:
Thanks! I look forward to the updated validation. I can’t seem to get the wall function version that I recreated from scratch to work for me either even though I set the first wall cell to be close to y+ = 30.
I just wanted to check in to see if there has been any progress on this validation. I have gone through many different meshes and simulations but I still cannot get either the Wall Function or the Resolved versions of this geometry to match Darcy-Weisbach even close.
Can anyone from SimScale report back on this issue?
Hi @mas985,
excuse the delay on this! Due to an upcoming bigger release, the follow up on this got a bit delayed. I just checked - the issue is in progress and we’ll provide more information shortly!
Best,
David
Quick update, we have fixed the issue and, after next week’s release, if you now simulate the case with wall BC, you’ll get the correct result. That’s good, but don’t go away just yet. We are preparing a new project and writing more details on the reason and some documentation around it. All will be updated here soon.
EDIT: added time of release
Thanks! Looking forward to the explanation and new project.
Is this the update you were talking about?
I just tried the Wall Function validation and it still gives me the same wrong answer.
BTW, is there anyway to find a release number anywhere on this site for the current SimScale version?
A full set of release notes including bug fixes would be helpful too.
No. The update will come this week. I’ll update here when it is available.
There is no version or release number to refer to.
Indeed. A quick hint for everyone who reads this, you will find a shortcut to most recent release notes in your workbench on top.
On top where?
There should be a blue bar across your workbench on top. I’m not sure though how to bring it back if you’ve hidden it. In any case, you land here: What's new on SimScale? - SimScale CAE Forum
It might be useful to have a link in the help menu.
But correct me if I am wrong, I don’t think I have ever see bug fixes in those. Only new features.
Alright, the fix is live and we made sure to update the content around it. Have a look at the following (or see this reply from @dzivkovic):
Documentation page:
Validation project:
noted.
Indeed, those notes focus on new features.
Thank you!
I have a few follow up questions for @dzivkovic regarding the new validation. In the documentation, there is this statement:
A uniformly-spaced hexahedral meshes were generated on the SimScale platform, using the hex-dominant parametric meshing operation (see Fig.2.). For the “wall function” approach, the first cell layer thickness was set to 0.5 mm assuming y+≈30. For the “Full resolution” case, the first cell layer thickness was set to 0.041 mm assuming y+≈1.
If I use this tool: CFD Online - Y-Plus Wall Distance Estimation
I get a y+=1 of 1.4e-5 m and y+=30 of 4.2e-4 m. Since this represents the cell center, the cell width should be twice this value or 2.8e-5m (0.028mm) for the resolved case and 8.4e-4m (0.84 mm) for the wall function case. When I did a yPlus output plot for your wall function case, it was around 20 which is to be expected given the above calculation.
How did you come to your values and why are your two values for the two cases not a ratio of 30 (y+ 1:30)? The wall function case obviously yields the correct results even though the y+ value is less than 30 but I thought that was a no no according to other SimScale documentation.
My second question is around the initial conditions of k and omega. Looking at the average output face values of k & omega, they are quite a bit larger than the initial conditions. I am assuming this is because of the fully developed flow so I was wondering if there is a way to determine fully developed exit values for k & omega and would it not better to use those as inputs?
Lastly, the meshes were imported into the validation project so there is no documentation on exactly how they were created. Can this be added to the project?
Thanks again
To answer the questions from @mas985:
I get a y+=1 of 1.4e-5 m and y+=30 of 4.2e-4 m. Since this represents the cell center, the cell width should be twice this value or 2.8e-5m (0.028mm) for the resolved case and 8.4e-4m (0.84 mm) for the wall function case. When I did a yPlus output plot for your wall function case, it was around 20 which is to be expected given the above calculation.
How did you come to your values and why are your two values for the two cases not a ratio of 30 (y+ 1:30)? The wall function case obviously yields the correct results even though the y+ value is less than 30 but I thought that was a no no according to other SimScale documentation.
I see that the documentation did not explain well enough how we arrived to those values and which choices we made in the process. The target wall spacing was calculated with expressions similar to those you were using, but the difficulty with “wall function” approach and this particular case is that flow velocity is relatively low which makes boundary layers thick and, ultimately, the necessary first cell height for y+ = 30 relatively large (1/10 of the diameter). Satisfying the condition of high yPlus is not possible without severely coarsening the mesh. At that moment we decided not to coarsen the mesh any further and the result was a mesh with incorrect y+ values. Nonetheless, the results showed robustness towards non-ideal wall spacing, especially for kOmegaSST turbulence model which is known to give accurate results for yPlus being well below 30, because of the blending functions it is using. Regardless of that, one should always try to achieve the recommended average yPlus higher than 30 in most of the domain, so I created a mesh which does that. With this new mesh you can see that results of pressure drop for kEpsilon are significantly improved. There is a trade-off, however: as mentioned earlier, such a coarse mesh near the wall doesn’t capture the velocity profile very well. The corresponding documentation page will soon be updated with the results obtained with the new mesh.
… the meshes were imported into the validation project so there is no documentation on exactly how they were created. Can this be added to the project?
Meshes from the old validation projects were just imported to the new one. Since some valuable information on meshing settings is lost in this way, as you correctly pointed out, I updated the project to include the mesh creation step.
My second question is around the initial conditions of k and omega. Looking at the average output face values of k & omega, they are quite a bit larger than the initial conditions. I am assuming this is because of the fully developed flow so I was wondering if there is a way to determine fully developed exit values for k & omega and would it not better to use those as inputs?
Prescribing turbulent BCs is often very tricky and one of the difficulties of turbulence modeling. For fully-developed pipe flow, you would ideally prescribe profiles of all flow quantities at the inlet, including those which model turbulence (k, epsilon, omega…). For some cases, including duct and pipe flows where accurate profiles of turbulence quantities are unknown, it is acceptable to specify uniform values, while being aware that flow needs to develop inside of the domain. For external flows, constant values are appropriate if the boundary is far enough from the object of analysis.
If you look at the expressions used to estimate inlet k and omega/epsilon in the validation page you will see that the value of turbulence intensity is the basis for their calculation. For most industrial cases, turbulence intensity is hard to know without experimental data, so it is usually heuristically assumed to be in range of 2-15%. For pipe flow, on the other hand, the expression I = 0.16Re^(−1/8) is commonly used, as it was in this study. This empirically derived expression estimates the turbulence intensity at the core of a fully-developed duct flow. One more common assumption is made here, that the turbulence length scale is 7% of the hydraulic diameter. Regardless of the many unknowns in the face of this problem kEpsilon and kOmegaSST models are usually robust in regards to variation of prescribed turbulence quantities the inlet. However, if a gross mis-estimation is introduced, it will be clear form lack of convergence and nonphysical nature of results.
Thank you. That makes it very clear.
A follow up question if I may.
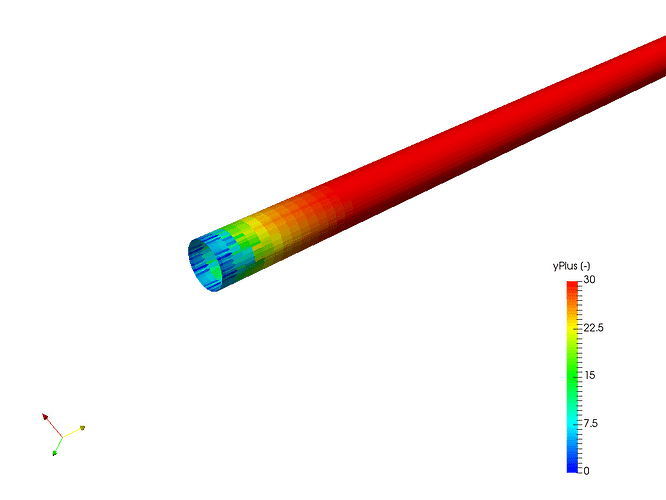
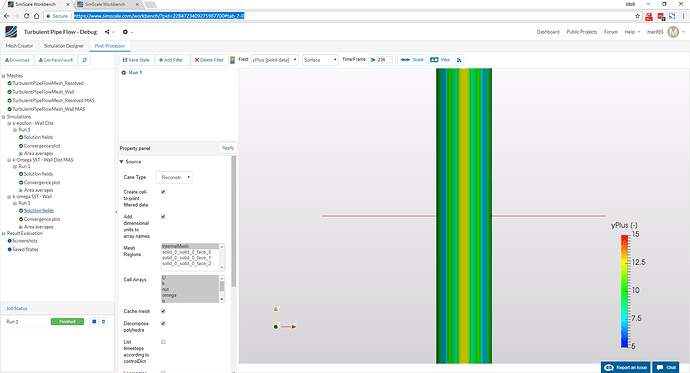
When I created the YPlus output, I noticed that it was non uniform around the circumference of the pipe. Is this due to the meshing? I would have thought the flow should be uniform in circumference and so should Y+.
Thanks again for your help.
If yes, then the reason is mesh refinement that was introduced to the pipe inlet and outlet surfaces to capture the feature edges. With the coarse settings used for the rest of the pipe (which gives correct y+) those edges were “wrinkled”. Since mesh is finer in that region yPlus values (non dimensional wall distance in which their cell centers fall) are also smaller.
No not the inlet but the entire pipe. I get stripes alone the length of the pipe on my run so it doesn’t look like yours.
I think I know what the difference might be. It looks like you added a reverse inflation layer to the mesh that I did not have. That is not mentioned in the validation documentation. It appears to be done to get the surface cell to be around y+30 and to make the surface mesh more even.
It looks like you added a reverse inflation layer to the mesh that I did not have. That is not mentioned in the validation documentation. It appears to be done to get the surface cell to be around y+30 and to make the surface mesh more even.
Exactly, as announced in my long post above, I worked to get that new mesh satisfy the y+ criterion. And if you have a look at the validation page now, you will see the updated results and a more detailed explanation.

