@aceci - it’s a technical problem from our end, we will get the platform up and running as soon as we can!
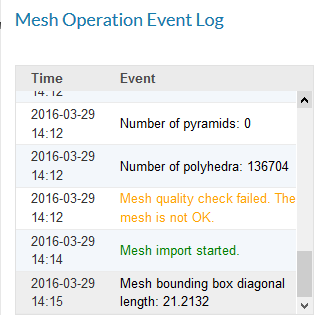
I’ve followed the steps to mesh the geometry as described and although the log states there are no errors it has failed the mesh quality check.
Does it make sense to run the simulation with the poor mesh? Seems a strange outcome for a tutorial
Hi,
this the my mesh log file:
Checking final mesh …
Checking faces in error :
non-orthogonality > 70 degrees : 0
faces with face pyramid volume < 1e-13 : 0
faces with concavity > 80 degrees : 0
faces with skewness > 4 (internal) or 20 (boundary) : 0
faces with interpolation weights (0…1) < 0.02 : 0
faces with volume ratio of neighbour cells < 0.01 : 0
faces with face twist < 0.01 : 0
faces on cells with determinant < 0.001 : 0
Finished meshing without any errors
Finished meshing in = 214.58 s.
End
Finalising parallel run
There are no errors regarding the mesh quality. If you are talking about this one:

Don’t worry. This is a different kind mesh quality test which is not mandatory for CFD simulations.
Cheers,
Milad
Yes that is the one i see, thanks
Thanks for the answers man  , yes of course i know about the increasing of computational time and memory usage due to number of elements increase. About the values of forces i see that there is roughly a difference in a range of 2% to 6% in the results final value (considering only the pressure forces and moment) between the two simulations.
Hi
I got for the F1 aerodynamics Workshop Homework 2 a Mesh Error for the Rear Wing geometry (the one with loures). The Rear Wing _2 geometry (withouth loures) meshed without problems
These are the Error messages in my Mesh Operation Event Log:
The tesselated surface is not closed. There could be a problem with the CAD geometry (such as self-intersections). Please inspect your geometry. Trying to proceed anyway.
Illegal triangles were found after surface tesselation. There could be a problem with the CAD geometry. Trying to proceed anyway.
Mesh quality check failed. The mesh is not OK.
This is the project’s link
Please advice
Thanks for your help
Regards
Jorge
Interesting, the variations seem to be low (2-6%), but I think this has to be judged depending on the purpose of the simulation. If for example you are using this to validate design changes, and it shows an advantage of 5% in downforce (I think this is a lot), how do you know it doesn’t come from the mesh?
That sounds like exactly the same problem I had. See earlier response that it is ok to use the mesh as is for processing
Ok thanks for the help . i just wanted to confirm
For the simulation without the louvres, do we have to upload another CAD?
It’s in the project. its name is Rear_Wing_2
Hi, in the following link you will find the results of my homework 2 with some images and the downloaded cases for 80 m/s, both meshes.
I have done the meshes using the final layer thickness equal to 0.9 like in the modified simulation of homework 1.
The fact is that I experience very small changes in the drag in the second case. What can cause such this behavior?
Thanks a lot for the help
Alessandro
Is the problem in the CAD or in the mesh? If it’s in the mesh, don’t worry and go ahead, I have the same problem ( I saw your mesh log)
Hi @ggiraldo, I just wanted to say that I really appreciated your response to this post. It was definitely helpful to understand what was going on, and also a great reminder of vetting simulations and not trusting every pretty fringe plot that’s generated. Thanks.
Oh, this is a really kind answer from your part. I’m so glad I could help a little bit!
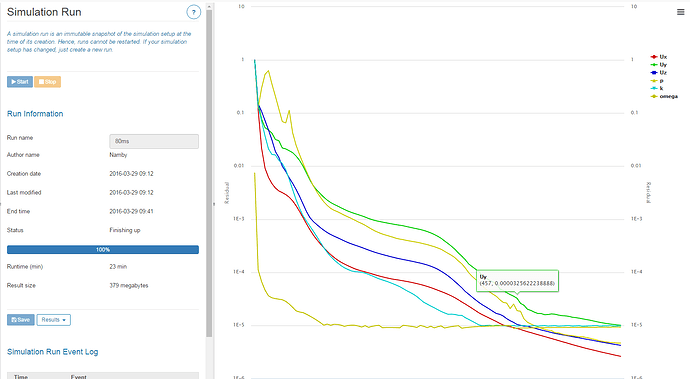
Has anyone run into the same problem I have? I finished all the runs (I ran 10 instead of 6, based on the table that was posted), but 3 of the runs are stuck and not producing results. The run status says 100%, but it does not show up in my post processor. And it finished 2 days ago.
Here is a screenshot of an example.
Can someone please help resolve this?
Ok, I have completed the simulaitons and have the results, but when I try to see the solutionfield so visualize the results, my browser just cloggs down for some reason, and can’t go past loading. 8GB RAM and i7 processor, with dedicated GPU as well. I don’t get it, chrome is worse of 'em all. In Firefox I can get to the point where I can select contours and crash. This way I can’t complete the homework to submit.
@Namby - this can happen from time to time if there is an interruption with the server when the simulation is being run (we’re working to fix this). For the three runs that are stuck, I’d suggest creating a new run and re-running it - this should resolve the issue
@rahulsharma_94 - based on the specs your computer should be fine for this, can you try again and let me know? Are you able to see the force plots?
Hi everyone,
Because of my ignorance about the software, i accidentally activated the free trial of the professional pack 12-13 days ago. This pack has only 200 core hours and i have unfortunatelly reached that limit due to the workload of the homeworks.
From what i read, my account will be automatically reset to community plan at the end of the 14 day free trial.
Unfortunatelly, i think that i will not make the deadline because the end of the free trial is sometime tomorrow (or even worse, the day after).
I have done half of the homework though, as you can see in the link below, and it is a matter of just one hour to finish it.
Would it be possible the deadline to get a small extension?
Regards
