Mesh Independence Study - Layering disappears across study meshes

When changing the number of cells in the background mesh box so that each progressive mesh in the study has roughly twice the cells of the previous mesh, how do you keep inflation layering from disappearing as the cell sizes get smaller?

I am not using relative size for layers since I need my yPlus range to stay constant in each simulation results.

If I reduce surface refinement levels as the mesh cell count goes up, then I believe that will change the results in itself and this changes the basis of study independence such that it is no longer a valid study. Am I correct on that?

Thanks,
Dale

Hi Dale,

I guess you would have to do this iteration of “simulate-until-you-have-the-correct-yplus” when you are refining your background mesh box again. Did you just give it a spin already and see what it does to your yplus value?

Cheers!

Jousef

Jousef, I have done it both ways and nothing makes sense right now.

My base mesh that I think the study will say to use as the ‘first steady’ results mesh has ~11,000,000 cells and its converged sim has good yPlus range.

I have made a 5,000,000 cell mesh and a 25,000,000 cell mesh. Only the 5m cells converged to results, the 25m errored and I am not sure why. I guessed that it was because, for the 3 meshes, the weighted % inflated went from 92% 5m to 84.8% 11m and then to 72.2% 25m.

All the study meshes are free of any illegal face etc. and have very clean edges.

Since the 25m failed to converge, and I was so sure that I should tweak refinements to get % layered back up for each mesh, I deleted these first 3 meshes and sims (darn, but I did have some notes about them).

I then tweaked surface refinements to get 3 NEW meshes with 93.2% 5m, 96.2% 10m and 98.4% 22m.

5m and 10m ran to convergence but 22m stopped due to me not having a large enough max runtime :disappointed_relieved:, but it was close to convergence with no oscillations at all. The results had a slight Up,Down,Down trend on Cl, Cd, Cm when the max runtime error halted the run. This is why there are yellow cells in this chart:

So, I am very worried about the study, there is no appearance of stable values being reached and I dread having to make the next mesh and sim for a 50,000,000 volume mesh.

Right now I have come to believe that a mesh which is the subject of any Mesh Independence Study SHOULD NOT be layered (and for sure not with an absolute total layers thickness).

The reason I say that is, I believe that ideally for each successive mesh in the study, it should be the previous mesh with each of its cells x,y,z dimensions exactly split in half. That way, there would be no question that each mesh represents a finer meshing of the previous mesh. If a mesh is layered (especially at constant total layers thickness) then the resultant mesh will NOT be a finer representation of the previous one and you should not expect the have results that level off as the meshes get finer. (I hope that someone else understands what I just said :slight_smile: )

So, before I do a 50m volume mesh and sim (Ugh!!!), I think I should take the layering off the base mesh and create the other meshes with no changes in refinement levels at double and 1/2 the background mesh x,y,z cells. Then I should plot the results and re-evaluate the situation…

What do you think?? (ugh another monster post :upside_down_face: after an allnighter)

Dale

AND I am just running out of core hours, I guess there will be a slight delay in this topic…

If it helps, here are the results of two of the first three meshes (that were deleted) and which did converge. (these were NOT tweaked to maintain % inflated):

@1318980 and @Get_Barried HELP :heart_eyes:

EDIT; Since I did this study I have come to realize that I should not look at Cm as a variable that should be evaluated as a percentage of the previous iteration for MIS study use. The reason is that we can re-map the Cm to any value, including 0, simply by moving the Reference Center if Rotation point that determines the Cm moment arm for any simulation run. So, please ignore the Cm plots…

Hi Dale,

sorry for the delayed response. Pretty long post :slight_smile: Let me have a look at it and see what approach might be the best here. @1318980 and @Get_Barried as well as @vgon_alves, feel free to jump in here.

Best,

Jousef

Hi @DaleKramer,

Lots work being put in! Great dedication on your end.

For me the mesh convergence study aims to just ensure that grid sensitivity (how the results react to how fine the mesh is) is within reason. Within reason typically means deviation of results between 1% to 5%. If the results are within that margin then I deem the coarsest mesh within that acceptable deviation to be usable for simulation.

Now obviously the question arises (that I think is your concern), what if as i continually increase the fineness of the mesh, the results continue to deviate such that say i did 5 meshes and the finest mesh has deviated more than 5%? Also how can I compensate for this when I only did 3 meshes? How can I know that the 4th and 5th mesh don’t go past 5% deviation?

Aside from actually meshing and simulating the results, there is no real concrete way to deduce this (as far as I know). Hence the importance of validation of the final results. The mesh convergence study is as mentioned, simply just to deduce grid sensitivity and give you the “best mesh” possible that will not severely affect results rather than getting accurate and correct results.

Obviously this then again brings two more questions. How do I know that the deviation is less than 5% after 5 meshes of increasing fineness and what if I don’t have experimental results?

The answer to the first questions is, you don’t. I believe there might be specific recommendations that have different criteria for grid sensitivity that don’t simply rely on result deviation but I haven’t looked into those. Refer back to the point of the mesh convergence study as I mentioned at the end of the 3rd paragraph. If you don’t have experimental results to validate, then it will be a little tricky. You can make reasonable assumptions based on the results you get or follow how validation cases are setup and tailor those cases to your own use case to get something that produces realistic results.

Hopefully the above paragraphs will answer your “result stability” question. Now, onto the actual results. I’ll be looking at the new set of meshes you did.

Comparing the CL, mesh 1 to mesh 2 (1 being coarsest and so on), deviation is less than 5%, mesh 2 to mesh 3, its around 6%. For CD, 1 to 2 is less than 5% and 2 to 3 is also less than 5%. Taking a look at the CL/CD difference, 1 to 2 is less than 5% and 2 to 3 is less than 10%.

From this I would say that your mesh is relatively accurate. Some data points as you can see are not within margin but are still quite reasonable as they are all less than 10% within each other. Thus using mesh 2, the one with 10 million cells should give you reasonable results with a margin of error around 10%. If you want to investigate another finer mesh, increasing it by 1.5 times of the finest mesh to around 34 mil is a good gauge. However, I highly doubt you need that fine of a mesh as in reality the difference in results would be quite minimal in exchange for a large increase in computational cost.

A side note about the mesh convergence study. You can perform this not only for the whole mesh, but specific areas of the mesh like keeping all refinements the same but only adjusting the fineness of say the layers. That would allow you to deduce the optimal setup for layer generation.

Hope this helps!

Cheers.

Regards,
Barry

3 Likes

Barry,

Thanks for the very detailed response, I guess I started ‘overthinking’ about what I was trying to accomplish with the study :thinking:

But, in thinking about your reply :smile:. I have these questions now:

  1. Lets say I did a study that did not seem to settle out, even if it did +/- 1% settle out, (say of meshes with volumes 1m, 2m, 4m, 8m, 16m, 32m, 64m ), but 8m,12m,16m,32m stay within +/- 5% of a median, and you choose to use 8m because of its ‘small’ size. Then, you come up with some experimental results that match 8m results exactly (well, very close). I guess I would have to just consider myself lucky :wink: and make sure that whoever I am talking to about this magic coincidence of apparently precise CFD results validity, also understood that it was a lucky coincidence of the match and that generally CFD is currently capable of only predicting results within a +/- 5 percent range AND only if you really know what you are doing in your CFD setup. Is that a good generalization?
  2. What do you think of my concept of perhaps doing the study with unlayered meshes to choose the ‘best’ one for your purposes. After that selection is made, do your layering on it and use that one for further analysis at different airspeeds and angle of attacks (constantly making sure each results generated has still a good yPlus range of 30-300 in my case) with the basic understanding that your results may be valid +/- 5%?

I am sure I will be ‘thinking’ of your reply much more and have further questions but that is a start :wink:

Thanks,
Dale

P.S. Sorry about my perpetual use of bracketing in my prose. I guess I just get rambling and come to a fork in my thoughts. Each bracket represents a side fork or branch sprouting from a trunk. I even use brackets inside brackets inside brackets… sometimes :upside_down_face:. This style leads to much re-reading but does have some logic in it, If my sentences were trees and my brackets were branches then I guess I am a spruce tree, perhaps I should try to be a redwood :smile:
Barry,

While you are pondering my above questions, I decided to just give my idea of my Question #2 a try.

I really wanted to just take layering out of the equation and then see if I could obtain a more meaningfull Mesh Independence Study.

Unfortunately here are the results:

I decided to present my plots with y-scaled as a percentage of the value of the largest volume mesh (as we expect the largest volume mesh to be the best prediction of results).

Without adding the 40m mesh to the study, I may have been content to use the 10m mesh for further study. After all my Cl was virtually the same for 10m and 23m, and my Cd was only different by ~12% from 10m to 23m.

But, I just wanted to see a further 40m mesh, stupid me :wink: .

Now I have Cl at 23m is only 83.6% of 40m while Cd is starting to behave, showing only 102.5% of 40m.

I just keep getting more confused :cry:

I was not 100% satisfied with my meshing.

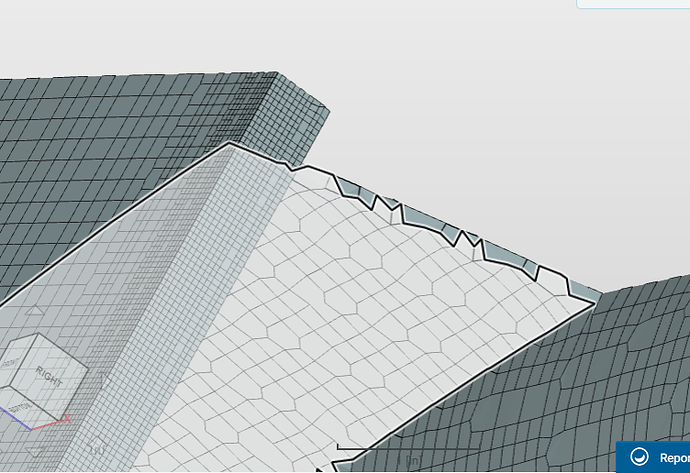
The trailing edges of my wings and fuselage are a little jagged due to Snappy’s inability to maintain clean geometry edges in the mesh that it generates, even at 40m volumes)

Here are jaggies on GNL3 40m mesh at trailing edge of my ‘vertical fin’ (so to say):

I could have made them less jaggy with another level of surface refinement but I chose not to because after I select which mesh to carry on with (from what this study suggests), I was then going to layer the selected mesh. However, to get good layer results I would have to reduce surface refinement back to the level I have done this study on. I figured that it would be best to leave as much of the mesh alone (other than layering addition) after I selected a mesh from this study as possible.

Anyway I don’t really think the little jaggies are the problem here (I could be wrong).

@Get_Barried, I am sending you another invite to the current state of the project if you want to see for yourself. The GNL meshes are the last 4 meshes and the sims are the last 4 sims.

@1318980 I think you are currently shared on this one, I assume you can just copy/view the latest state at any time.

Project is getting rather large now as I leave my ‘learning curve’ meshes and sims in it.

Dale

EDIT; Since I did this study I have come to realize that I should not look at Cm as a variable that should be evaluated as a percentage of the previous iteration for MIS study use. The reason is that we can re-map the Cm to any value, including 0, simply by moving the Reference Center if Rotation point that determines the Cm moment arm for any simulation run. So, please ignore the Cm plots…

Hi @DaleKramer,

Yes you can get lucky at time and get results that do indeed agree very well with actual results. 95% of the time, you won’t be that lucky. Increasing complexity and the different use cases will further increase the odds of “getting lucky”.

That sounds alright. However, depending on your use case, the presence of layers may adversely affect your simulation. So you might want to keep that in mind.

Increasing the fineness of the mesh does not always result in linear behavior of results. While your CD may seem to behave as expected, it dosen’t directly mean that your CD will behave. Quirks in the mesh even with increased fineness can and will affect the results in a non-linear way. This is due to how SnappyHexMesh is a iterative mesh builder and quality of each individual mesh can differ significantly. There may be other reasons both large and small from the mesh that cause this non-linear behavior. That is why the mesh independence study and validation of results are so critical to any CFD analysis. As @jousefm put it in our funny conversations, CFD can be also called “Colorful Fake Dynamics” without proper validation and setup.

Overall, they do not have that significant of an effect. A workaround would be to increase feature refinement or make the edge a separate entity and add a high level of surface refinement to that so as to obtain the edge fineness while keeping computational cost low. I’m sure there are options to increase edge refinement but I have not dabbled too deeply into the parametric controls yet.

Hope this helps!

Cheers.

Regards,
Barry

So, if we only have this Independence Study:

What can I conclude from it? I think not very much. I think the Cl and Cm behavior are just not a good thing :slight_smile:

And what is the next step to get a valid study here?

EDIT; Since I did this study I have come to realize that I should not look at Cm as a variable that should be evaluated as a percentage of the previous iteration for MIS study use. The reason is that we can re-map the Cm to any value, including 0, simply by moving the Reference Center if Rotation point that determines the Cm moment arm for any simulation run. So, please ignore the Cm plots…

Thanks,
Dale

Hi @DaleKramer,

I would stick to the 10mil mesh first, simulate that then validate your results.

So yes you’re almost there, unless the results are very off from the validation then we’ll need to more digging. See if you can deduce how far off the 10mil mesh results are from the validation results.

Cheers.

Regards,
Barry

But I am trying to design an airplane using CFD results. If the CFD results are off too much my airplane with crash :cry:

Hi @DaleKramer,

Is there some way you can get a good estimate on how the CFD aircraft is performing based on similar past aircraft?

Cheers.

Regards,
Barry

Nope, it is pretty unique… :upside_down_face:

The application may be unique but the simulation steps, mesh setup, and results will vary in the same way, this is why validation is important. We might not be simulating the exact same thing but, validation and verification will confirm the mesh is fine enough and the assumptions are fair (there may be other reasons but these are the two normal reasons for poor CFD results). In terms of building a plane without ever checking your setup, that might be bad (unless it works, then your lucky :wink: ).

I guess what I am saying, is its all very well and good simulating a unique craft, but maybe the first step should be simulating a ‘normal’ craft with an abundance of data to ensure we are not making poor assumptions.

But in terms of this mesh independence, I am not sure I understand the relevance of % of largest volume? I think it just over complicates, do the graphs look similar without it? and also, do they reach the same level of convergence?

Best,
Darren

1 Like

I am under the impression that we can expect the mesh with the largest volume to be the most representative of ‘correct’ results. If that is the case then all others can be referenced to results of the mesh with the highest # of volumes. The shape of the graphs will be the same but with my referencing, we can see at a glance what percentage difference each mesh with fewer volumes is different from the highest volume mesh. It just saves you from trying to do that percentage range in your head.

Wow, so I look to NASA and find ‘Tutorial on CFD Verification and Validation’. Where it says this about Verification and this about Validation.

It is going to take me a while to absorb all that. Darn, I just want to have some Force and Moment results that can be expected to be within a range of say +/- x % of what I will see if I actually build this plane.

I never build things without designing them first, I see CFD as part of the design process. Checking the setup of various design stages is done as a matter of course. I just want to know how much I can rely on the CFD results, this will determine things like how many different scale models to build and test before the manned version etc. :wink:

I am using ‘normal’ airfoils on basically a canard design that has a unique fuselage, it should not be much of a stretch to expect CFD to give me some valid results without having to build a wind tunnel model to see how CFD did. If I have to do that then maybe I should just do wind tunnel models. What I really need to determine is what mesh should I use and to come up with a guess as to how far the real life plane ‘Force and Moments’ can be expected to vary from the CFD results.

Any ideas how I can achieve my goals from where things stand now?

:smiley: yes haha, but that wasn’t the point I was making! I have no doubt at all that CFD is capable! The question is not can CFD do it, but more ‘have I made a good mesh?’ ‘The boundary conditions I have assumed, are they correct?’ ‘Is the bounding box I have left sufficient?’ ‘is the wall modelling I have selected correctly?’ ‘does the turbulence model I am using provide accurate results in my application?’

I am sure we could think of more, and moreover, there are many of those questions that you have been able to find out, mesh independence, comparing different modelling techniques etc. Which is good, however, some questions are best answered using a comparison of results. You see you could do this to a case where you already know data about, you don’t need a wind tunnel, moreover, you don’t need to validate CFD, you do however need to verify your setup, your understanding and your assumptions (after all modelling is about making correct assumptions). You would hate to find out your results were off because you didn’t explore turbulence models or how big the bounding box is, but most importantly, how much time do you put into investigating all this? maybe you got it right first time? then additional work is a waste of time! You will only know if all is good if you compare to something, then apply what you know works to your own application.

Does that now make more sense?

Best,
Darren

1 Like

Yes, as far as setup for my sim, I looked at a lots of the tutorials and my user profile shows I have been reading in this environment for nearly 3 days straight out of the last 4 weeks. I have not confirmed that my initial turbulence values are correct for my case yet, so far I just used defaults, it is on my list to review. I thought that could wait until after I select a mesh to evaluate in detail at various aoa’s and airspeeds, even adding some up/down elevator to geometry to start looking at stability cases. Also, hopefully, if you saw anything really weird in your brief look at the project I am sure you would have mentioned it :slight_smile: .

I am still stuck on the Independence Study, I will not carry on until it starts making some sense (or some sense gets knocked into me :wink:) .

Thanks,
Dale

Well, after many days and countless hours I have gotten Cl and Cm to behave.

I did it by changing the refinement procedure I used to create the base mesh which only gets its x,y,z Background Mesh Box cells changed to create all the other meshes in the study.

At some point when I have some time I will post back here what my refinement procedure actually was that allowed me to obtain a minimum value of % inflated for ALL meshes in the study of 98.6%. (EDIT; Actually it needed to be described anyway to carry on, here it is, a few posts ahead of here)

All study meshes have square cells (exactly) on all faces of the Background Mesh Box.

Again, I am using vertical scales on all plots that represent the plots data parameter as a percentage with respect to the value of that same parameter, in the mesh with the highest # of volumes (this highest volume mesh is expected to give the most accurate results). This eases the mental burden of just looking at numbers and trying to figure which is better and by what percentage.

Here is the study:

Unfortunately, though Cl and Cm are behaving, pressure drag is not.

EDIT; Since I did this study I have come to realize that I should not look at Cm as a variable that should be evaluated as a percentage of the previous iteration for MIS study use. The reason is that we can re-map the Cm to any value, including 0, simply by moving the Reference Center if Rotation point that determines the Cm moment arm for any simulation run. So, please ignore the Cm plots…

Dale

Hi @DaleKramer,

Considering all your data and the work you’ve put in, it probably comes to the numerical algorithms for the simulation. A good post from the CFD forums highlights this problem nicely which I shall quote here. The post was asking about why the velocity results for that particular simulation were not converging despite finer and finer meshes.

The velocity profile tends to be steeper on finer grids because there’s less numerical dissipation/damping. Convergence doesn’t mean the solution is accurate.

All else being equal (same problem, same initial guess, all settings equal), increasing the mesh resolution (finer mesh) will take more iterations to converge to the same solution.

It’s a result of the implicit discretization schemes which results in a sparse linear system. That is, changes in cell properties only affect their immediate neighbors. Hence, it takes many many iterations for adjustments of the solution to slowly propagate cell by cell throughout the entire domain to reduce the global error.

This behavior can be overcome/accelerated by using a multigrid algorithm to improve the speed at which global errors are reduced, but when you go to a finer grid (you need to make the multigrid method more aggressive). If you don’t change these settings in the multigrid solver, your finer grid would still take more iterations (because the coarse grid has more aggressive settings relative to the finer grid).

So basically at this point the discretization schemes are the likely the cause of continued divergence in results.

The solution would be to try other discretization schemes, maybe higher order ones if the mesh quality is sufficient.

Do see if the the sim can run (the 13 mil mesh) with other schemes.

Cheers.

Regards,
Barry

1 Like

Barry,

Very relevant research, thanks :smile:

I was hoping that there was a specific reason that pressure drag was not converging and it was going to be an easy fix, oh well …

Hopefully I can find a discretization scheme that will at least let me continue to hope that my finer meshes can be EXPECTED to give me the most accurate results :wink:

I will start playing with Hierarchial, and Simple decomposition schemes and see if I can get more confused again :wink:

Thanks for re-directing me with a gentle nudge … :smile:

Quick question, will the mesh quality parameters for Tet meshing work on a Hex Para for determining my mesh quality. I had a look at this a few days ago and couldn’t quite determine that?

Dale