Validation Case: Centrifugal Pump Curve Multi-purpose
This validation case belongs to fluid dynamics and aims to validate the following parameters of a centrifugal pump. The SimScale Multi-purpose solver was used to generate these results.
- Pressure drop [\(Pa\)]
- Power [\(W\)]
The results of SimScale are compared with the results of the study by WANG Xiu-yong and WANG Can-xing entitled “Performance Prediction of Centrifugal Pump Based on the Method of Numerical Simulation.”\(^1\).
Geometry
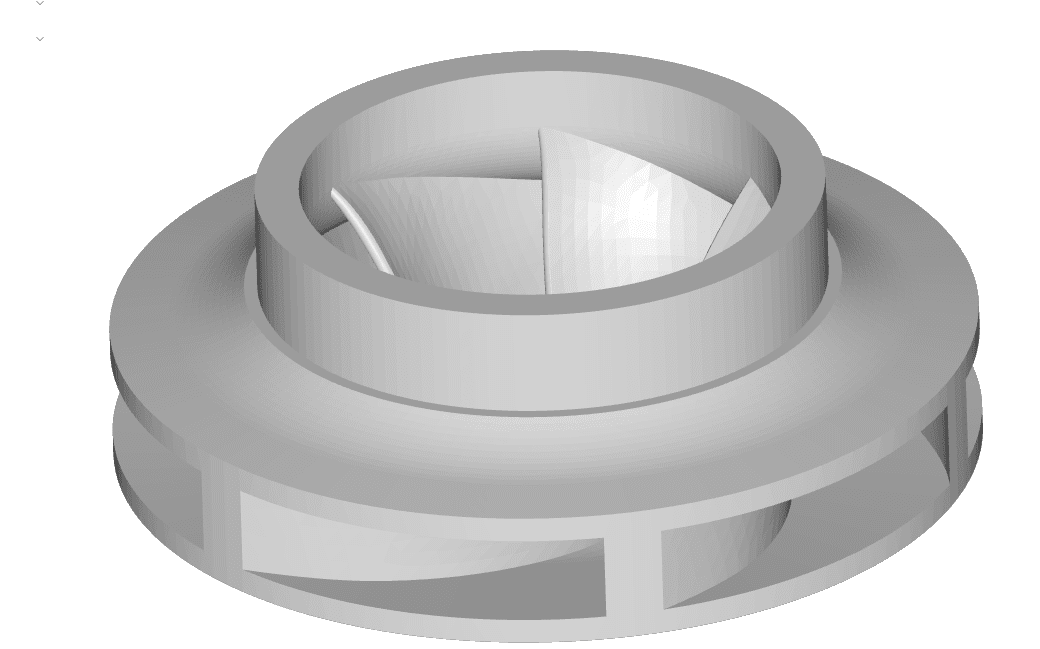
The CAD model used in this validation case is a centrifugal pump, shown below:
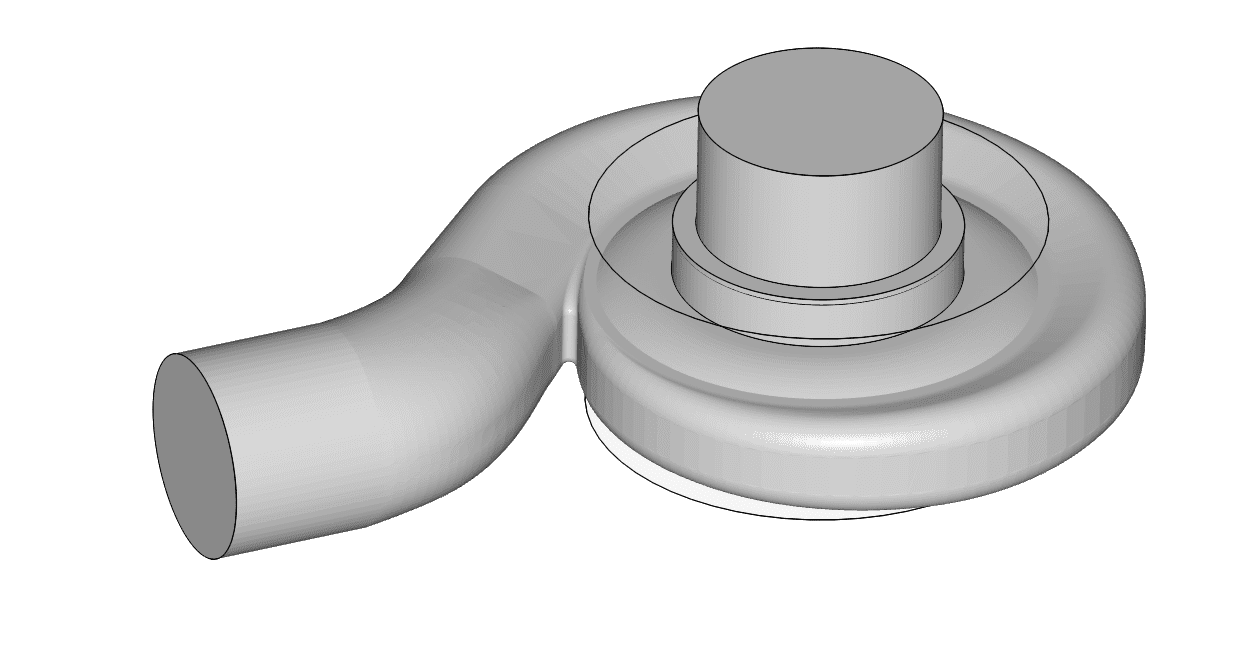
The dimensions of the centrifugal pump are listed in Table 1:
| Dimension | Value \([m]\) |
| Upstream Length | 0.041 |
| Downstream Length | 0.05 |
| Inlet Diameter | 0.075 |
| Outlet Diameter | 0.065 |
| Pump Inside Diameter | 0.075 |
| Pump Outside Diameter | 0.137 |
Analysis Type and Mesh
Analysis Type: Steady-state and Transient, Multi-purpose with K-Epsilon turbulence model
Mesh and Element Types:
The mesh was created with SimScale’s Multi-purpose Cartesian mesh. The automated mesher was used with increasing fineness for the global mesh, without the use of specific region refinements.
Mesh Sensitivity
The Multi-purpose meshing algorithm with hexahedral cells was used to generate the mesh. The mesh sensitivity study has been performed for the flow rate of 30 \( \frac{m^3}{h} \) using the automated mesh function with increasing fineness. The results of the sensitivity study can be seen in Figure 3:
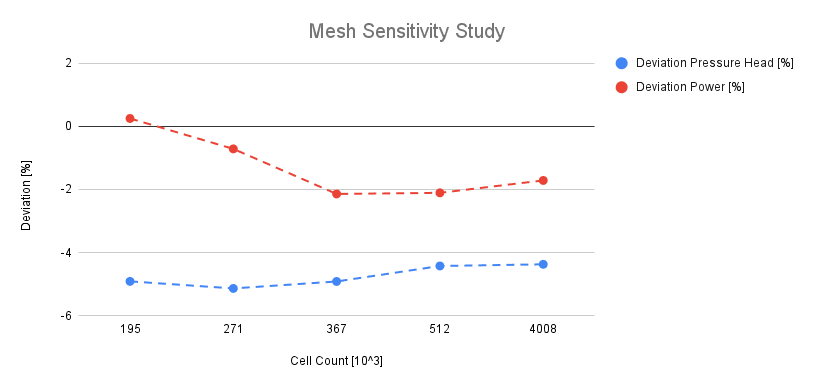
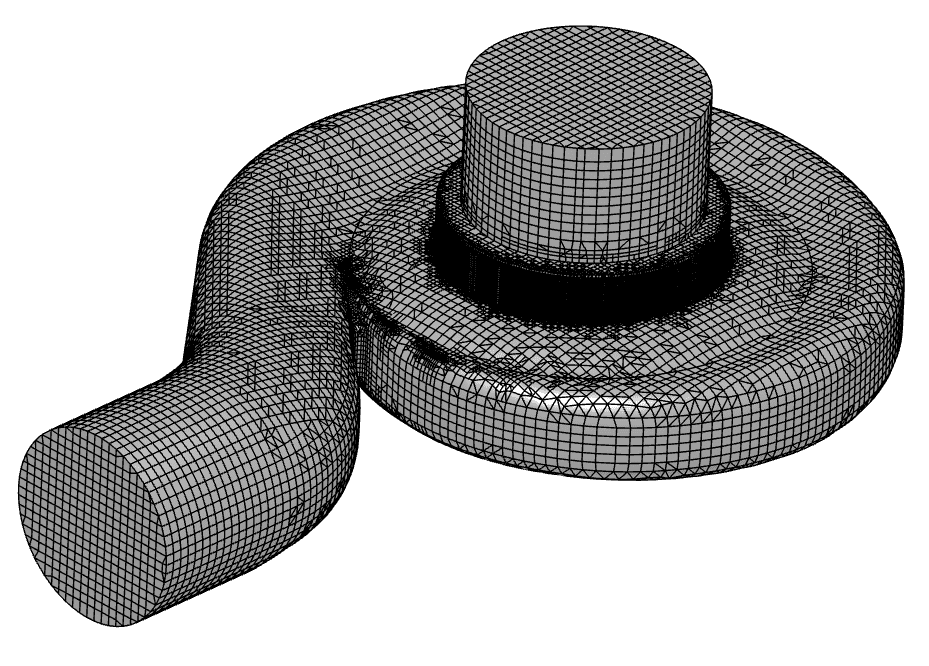
Based on the mesh sensitivity study the automated mesh at level 4 was selected to perform the simulations for the whole operating range of the pump. The mesh for the pump can be seen in Figure 4:
Simulation Setup
Three different volumetric flow rates were simulated. Constant pressure was set at the inlet and for all three volumetric flow rates at the outlet, the rotational speed of the pump was kept constant. The boundary conditions set for the fluid and the pump can be seen in Figure 5 and Table 2 respectively.
Fluid:
- Water
- Kinematic viscosity \((\nu)\): 9.3379e-7 \(\frac{m^2}{s}\)
- Desity \((\rho)\): 997.33\(\frac{kg}{m^3}\)
Boundary Conditions:
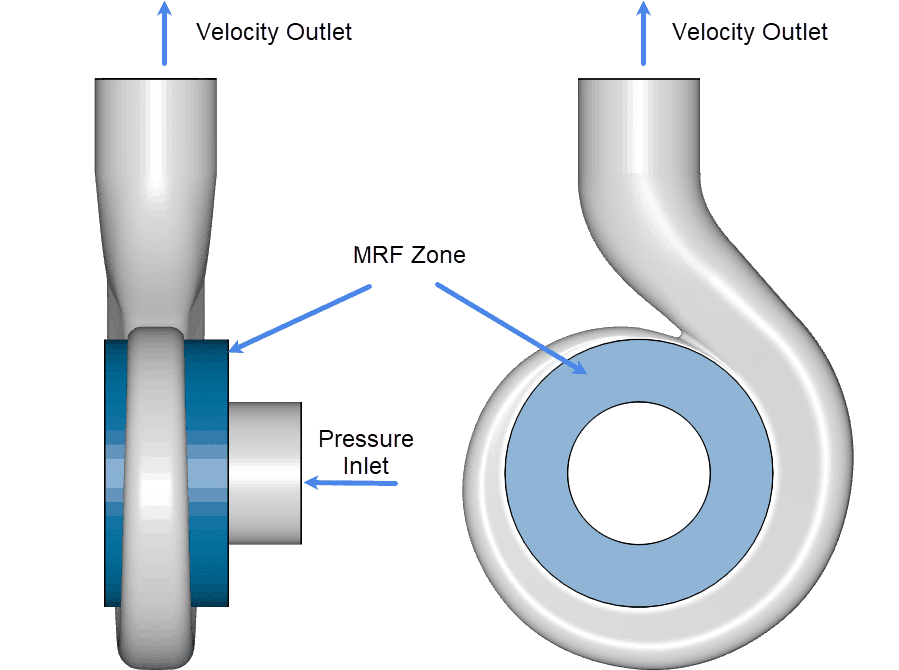
| Boundary Condition | Value |
| Velocity Outlet | (30, 50, 60) \( [\frac{m^3}{h}] \) |
| Totalt Pressure Inlet | 1.013e+5 \([Pa]\) |
| No-slip wall | Pump housing wall surfaces |
| Rotation Speed MRF Zone | 303.7 \([\frac{rad}{s}]\) |
Result Comparison
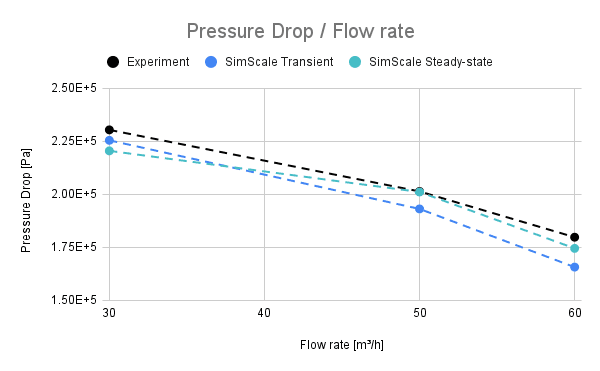
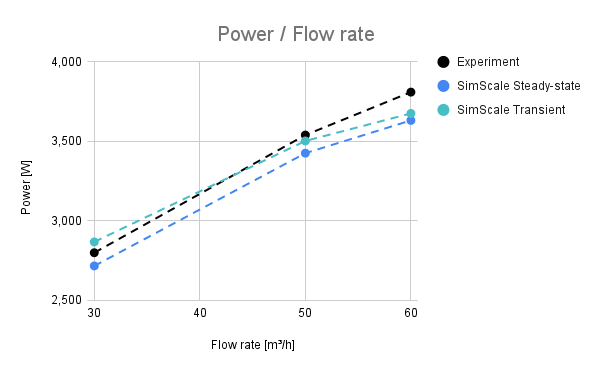
To compare the results obtained with SimScale with the experiment of WANG Xiu-yong and WANG Can-xing \(^1\), the pressure difference across the pump and the power consumption of the pump are measured.
Remarks
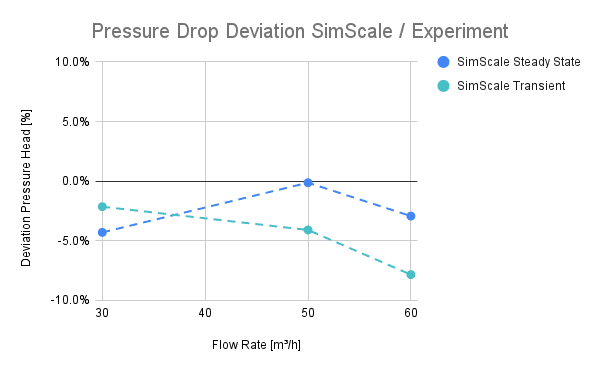
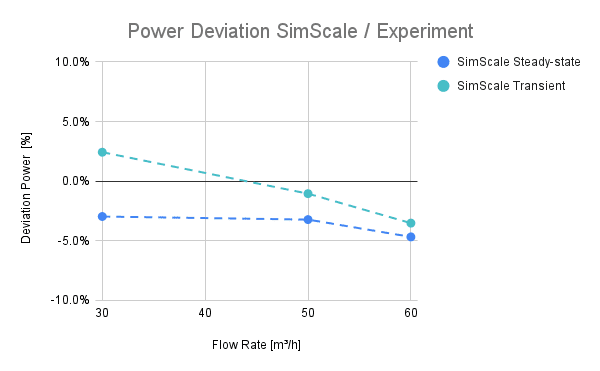
The deviation of the results obtained with SimScale compared to the results obtained by WANG Xiu-yong and WANG Can-xing is shown in Figures 8 and 9. The deviation is small for all volumetric flow rates. For the pressure difference, the steady-state approach provides better accuracy, while the transient solution has a smaller deviation in the prediction of the power.
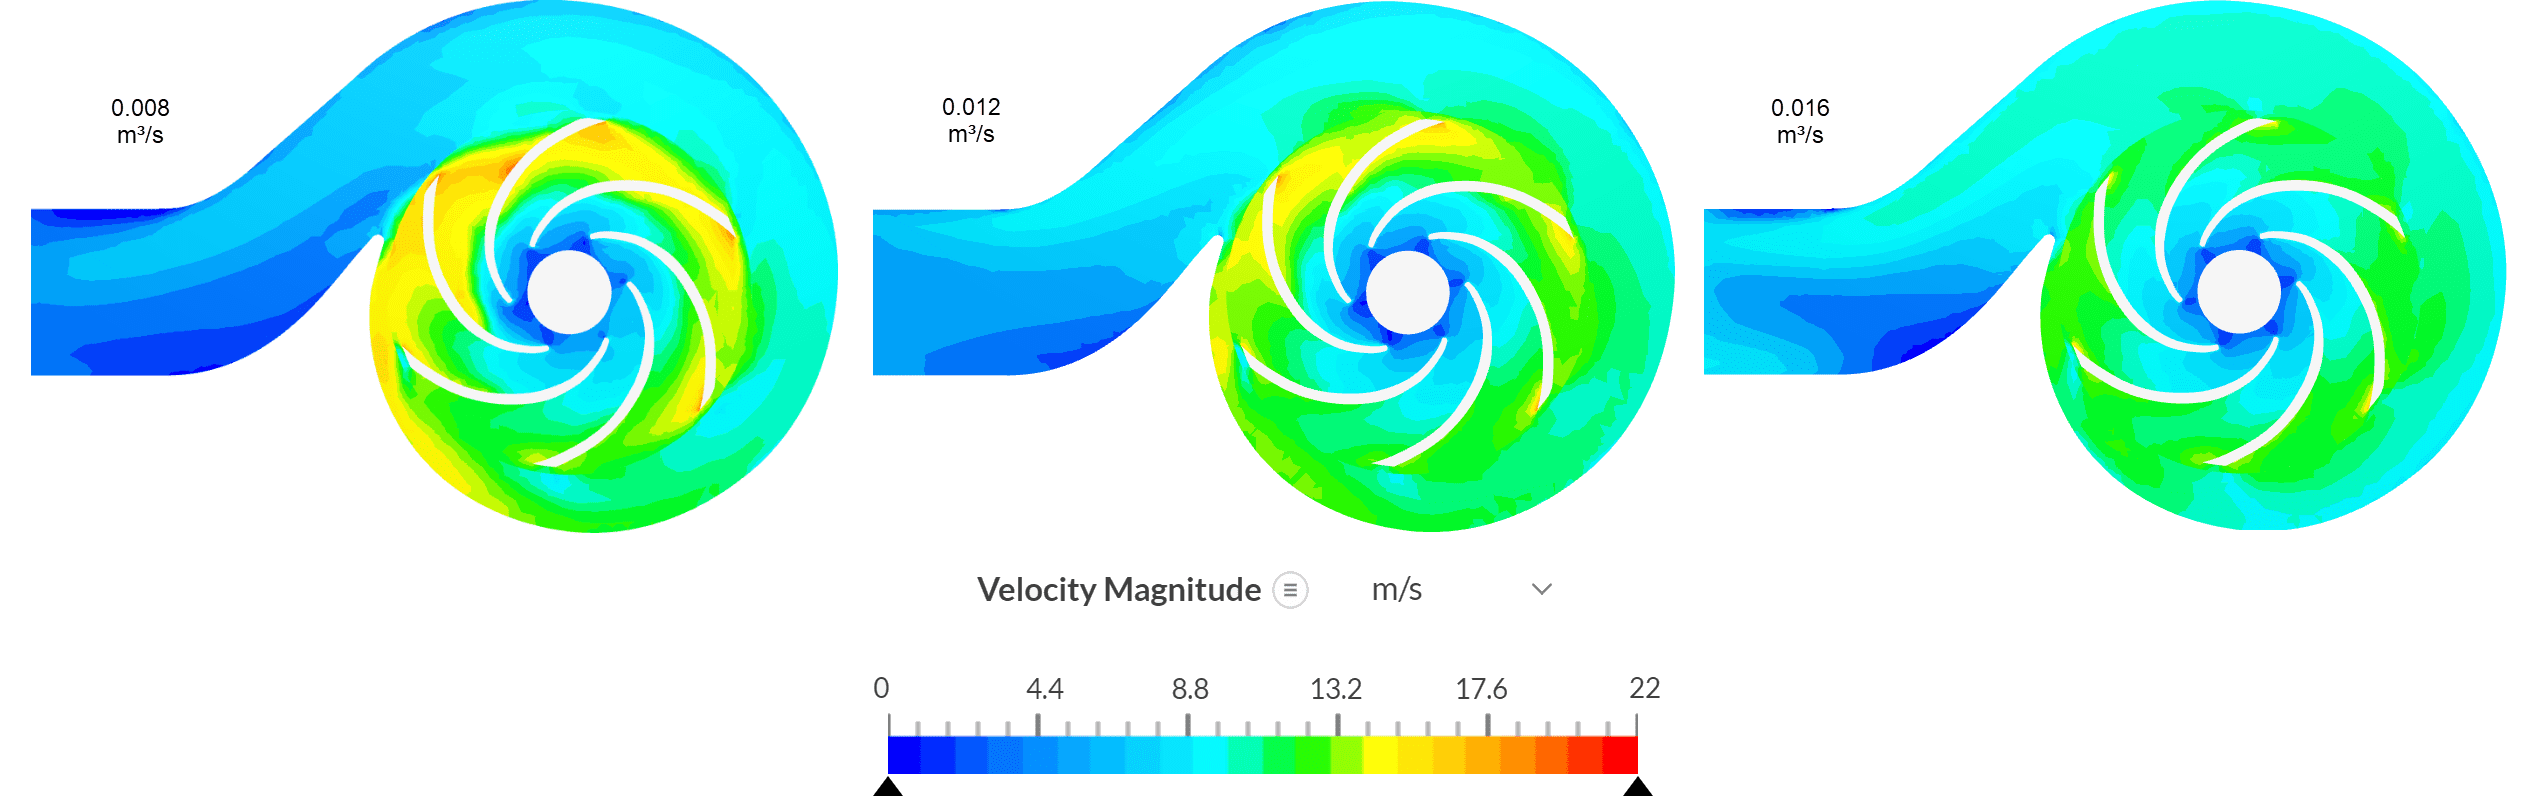
The flow contours inside the pump for three different flow rates as observed in our online post-processor:
Note
If you still encounter problems validating you simulation, then please post the issue on our forum or contact us.
Last updated: September 23rd, 2024
Did this article solve your issue?
How can we do better?
We appreciate and value your feedback.


