Most of us spend about 90% of our lives indoors. For that reason, it is critical to understand how indoor air quality and thermal comfort can impact our health and well-being. A poor indoor environment can have all kinds of adverse effects on the occupants, including sick building syndrome (SBS), allergic rhinitis, and hypersensitivity pneumonitis. Studies have shown that exposure to pollutants such as carbon dioxide is linked to significant decrements to decision-making. It directly impacts the productivity of the occupants and exposure to cold drafts or overheating can easily result in a health hazard. The World Health Organization estimates that 12.7% of deaths could be avoided by improving the indoor environment and ambient air quality around the world.
Thermal comfort is a key component of the indoor environment and, in most cases, it is also a legal requirement. The heating and air conditioning system can be said to have performed its task if occupants are not ‘conscious’ of the temperature inside the building. In this article, we will investigate how thermal comfort can be predicted and optimized with the help of computational fluid dynamics (CFD) simulation.
Sign up and check out our SimScale blog for much more!
Ensuring Thermal Comfort with HVAC for a School Building Design: Case Study Ramboll
HVAC system designers and mechanical engineers face thermal comfort problems on a regular basis. The main reason for poor air quality and low thermal comfort is often inadequate heating and air conditioning. Let’s take a real-life example and get a closer look at an engineering project that Ramboll UK, a leading engineering and construction company, executed together with SimScale. Watch the recording of a webinar where we discussed it in detail by submitting this short form.
The project was centered around the design of a school building in Scotland after the Department of Education issued new, more restrictive thermal comfort standards.

The goal of this project was to simulate the performance of the mixing box system case in a winter scenario, with the windows closed and the fans turned on. The model of the classroom was designed using Rhino and then imported into the SimScale platform.
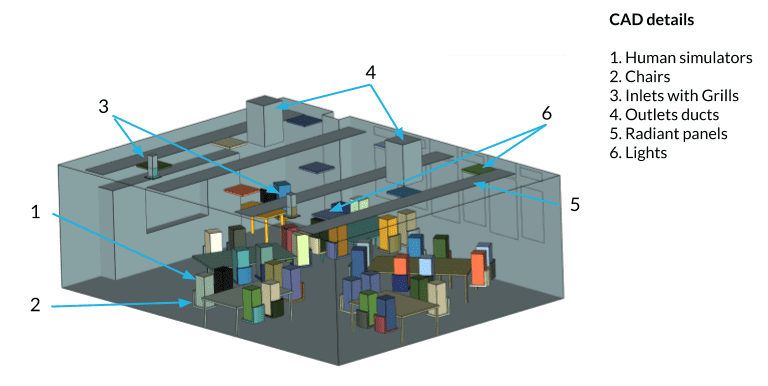
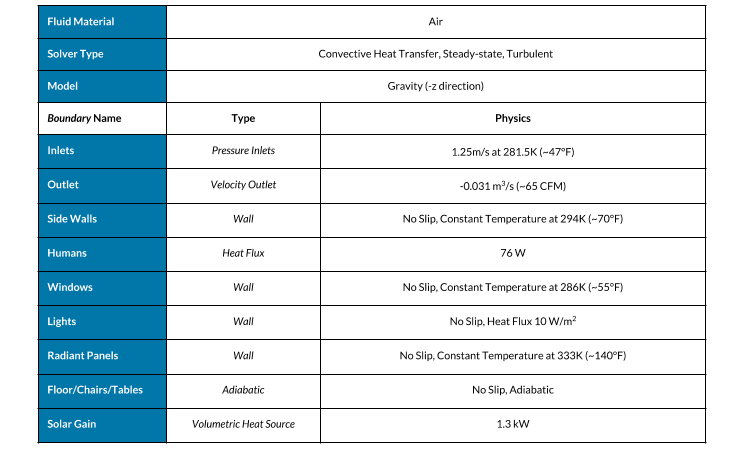
A mesh containing around 18.96 million 3D cells was then generated on the SimScale platform. The detailed summary of the simulation setup can be seen in the table below.
After running a CFD simulation, we have obtained qualitative and quantitative results showing velocity, temperature distribution, and thermal comfort, which we can use to adjust the heating and air conditioning system design or to rearrange desks and chairs in the classroom.
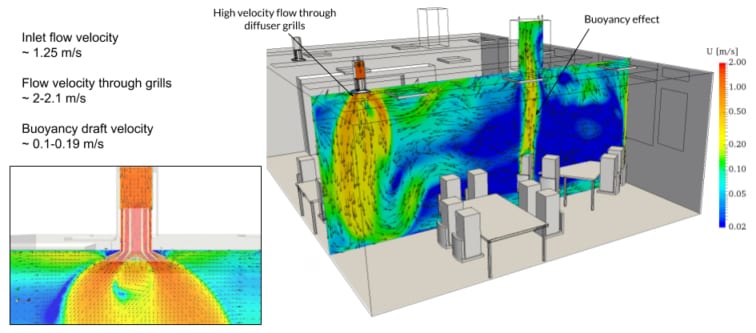
Looking at the velocity distribution, we can identify three regions of the flow—the inlet flow velocity, the flow velocity through the grills, and the buoyancy draft velocity. We can also observe a high-velocity turbulent flow in the area of the inlet. Natural convection can be seen near the cold windows.
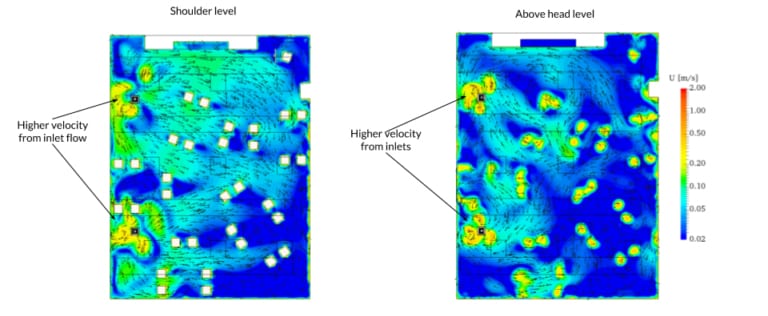
When we rotate the model and look at the velocity distribution at the shoulder level and above the head level of the students, we can see that none of the occupants are strongly affected by the draft from the inlets.
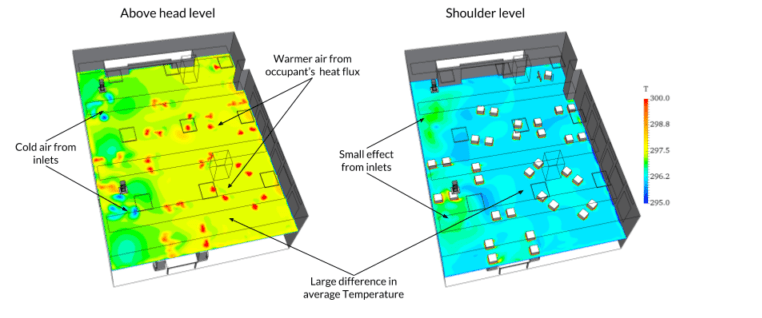
To accurately evaluate thermal comfort in the classroom, we would need to investigate temperature in addition to velocity. We can see that the temperature is much higher above the head level of the occupants, in the area of the inlets and outlets. However, at the shoulder level, an evenly comfortable temperature is maintained.
To estimate the thermal comfort, we will use effective draft temperature (EDT), a quantifiable indication of comfort at a discrete point in a space generated by combining the physiological effects of air temperature and air motion. A point is considered comfortable if the results are between –3° and +2°, and if the measured velocity at the point is less than 70 fpm (0.36 m/s).

CFD allows us to easily estimate and visualize EDT for every point in the room. We can immediately see several highly uncomfortable areas below the inlets, so we should avoid placing any occupants there. Overall, the classroom is currently designed to be thermally comfortable for the majority of students. However, the position of several tables and chairs may need to be adjusted.
Conclusion
The CFD simulation above was performed by Ramboll in a web browser using the cloud-based SimScale platform, using 22 hours of computational time (704 core hours). Performing the same simulation offline on a local computer would have taken up to one month.
This project from Ramboll was just one brief example of how a cloud-based CFD simulation tool can help engineers predict and optimize the performance of a heating and air conditioning system in the early stages of the building design process. This is a particularly relevant topic for the planning of green building projects and obtaining LEED certification, where sustainability, energy performance, and thermal comfort play a crucial role.
For a more detailed analysis of the results, as well as a commentary on the project by Ian van Duivenbode, a senior building physics engineer at Ramboll UK, watch the recording of the webinar below:


