The ever-growing demand for data computing, processing, and storage has fueled the expansion of energy-hungry data center facilities. A typical data center can consume as much energy as 25,000 households. In 2016, global data centers used roughly 416 terawatts or about 3% of the total electricity, and this consumption is expected to double every four years. [1] These numbers are a cause for concern, and in recent years, the reduction of data center power consumption has become one of the most pressing issues for data center operators and engineers to address.
Data Center Infrastructure Management (DCIM) with CFD
The energy required to store and maintain large amounts of data can be used with greater efficiency if the infrastructure of that data is appropriately managed. One of the most important aspects here would be proper temperature management, which is absolutely vital to keep the equipment running and maintain its functionality. Cooling systems tend to be highly energy-intensive, and often use as much (or even more) energy as the servers they support. On the other hand, a well-designed cooling system may use only a small fraction of that energy.
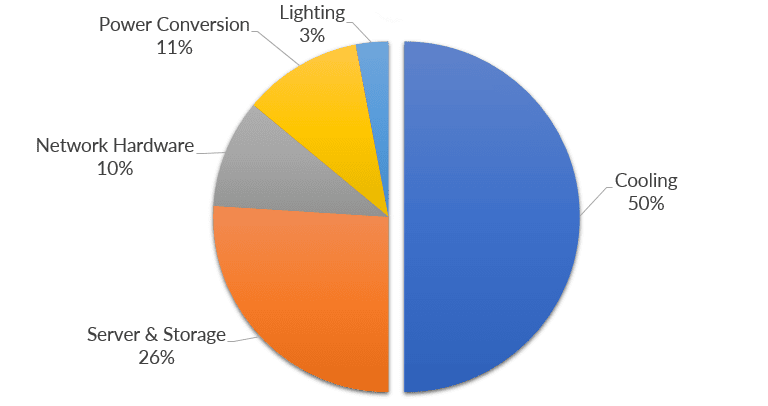
Moving with the need of the times, nowadays, various software tools have been developed to tackle the specific needs of a data center, referred to as data center infrastructure management (DCIM). One such tool is computational fluid dynamics (CFD). Fluid flow simulation allows HVAC design engineers to visualize airflow patterns and predict the flow distribution, and use this information to optimize the supply air temperature and the supply air flow rate, reducing the overall cooling costs.
To see how CFD simulation can be applied to reduce the cooling costs of an existing data center, watch the recording of this free webinar:
Measuring Data Center Thermal Performance
Facilities should be designed and operated to target the recommended range. According to ASHRAE, the recommended equipment intake temperature range is 20-25°C, while the allowable range is 15-32°C.
In order to measure how well the inlet temperatures comply with a selected inlet temperature standard, a measure called the rack cooling index (RCI) is used. RCI consists of two metrics: high end (HI) and low end (LO). RCI-HI is used to measure the equipment’s health at the high end of the temperature range. The RCI-LO is a complement to RCI-HI when the supply condition is below the minimum recommended temperature.
Project Overview and Simulation Setup
As an example, let’s use one of the projects from the SimScale Simulation Projects Library.
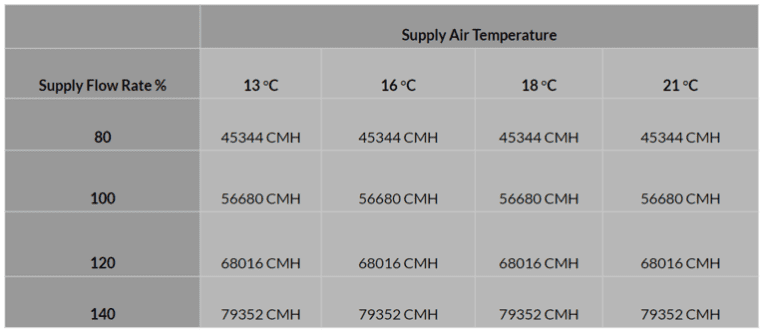
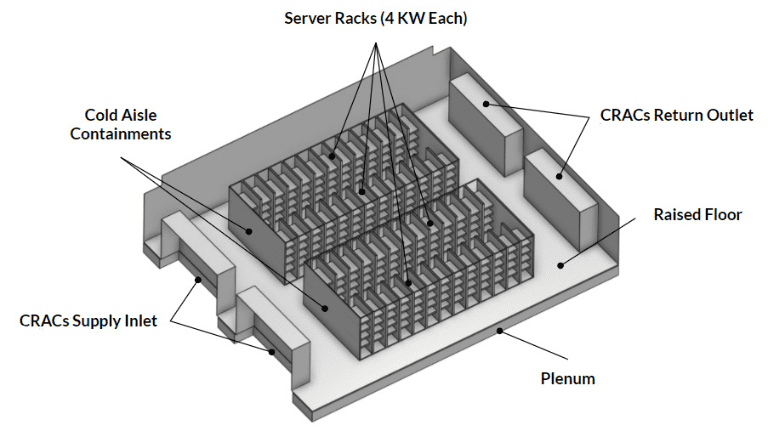
The aim of the project is to optimize the rack cooling effectiveness and reduce the cooling cost of a typical data center, housing four CRAC units. The modeled facility consists of 4 rows of 13 server racks each, for a total of 52 server racks. Each of them dissipates 4 KW of heat. As a result, the total space load is 208 KW. The total rack airflow is 56680 m^3/hr.
The key design parameters that we will evaluate are:
- Supply temperature
- Supply airflow rate
- Rack cooling effectiveness (RCI)
- Cooling cost function
With that in mind, we will analyze 16 different combinations of supply temperature and supply airflow rate, and their impact on the cooling effectiveness and cooling cost. The supply temperature that we will consider will vary between 13 – 21°C, and the supply airflow rate will range from 80% to 140% of the total rack airflow rate. The results will help us identify the best combination of the two parameters to optimize the overall cooling system configuration. This will allow a reduction in the data center power consumption.
Results: Reduced Data Center Power Consumption by 11%
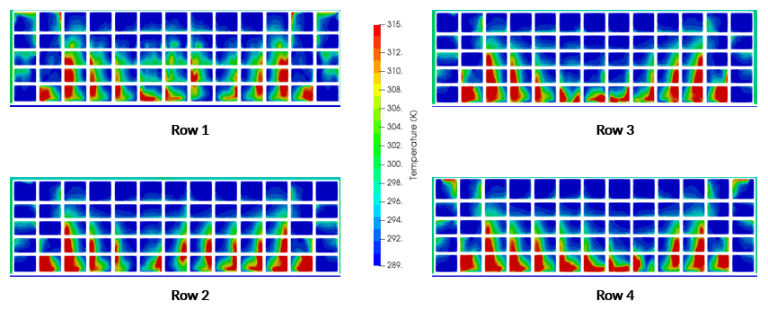
Let’s have a closer look at one of the 16 simulations that we ran at 120% of flow rate capacity with a 16°C supply air temperature. The image below shows the server intake temperatures taken as a slice—we can immediately see the differences between the rows.

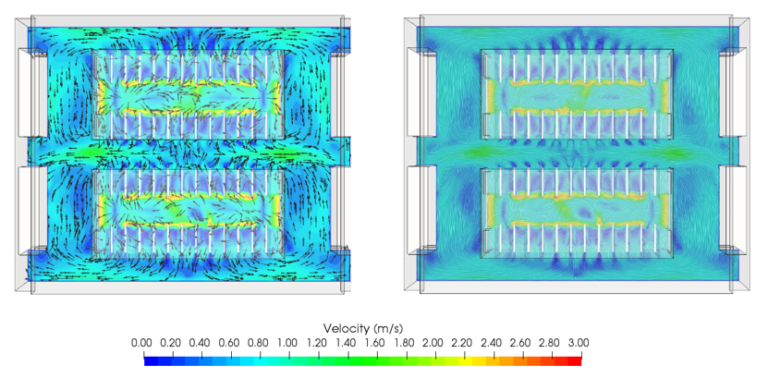
The velocity plots below provide us with additional insights into the behavior of the cooling system through the velocity plots with streamlines.
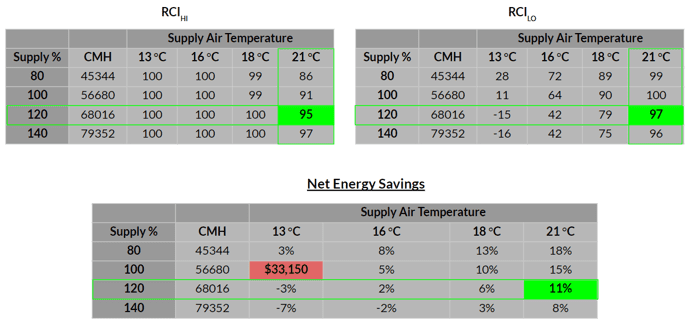
With the obtained results, we can calculate the relevant values for every one of the 16 configurations and determine the best performing one. Using the formulas we introduced earlier, we can calculate the RCI-HI and RCI-LO coefficients, which reflect the operational conditions for the system. Based on numerous studies, a value at or above 95% is a sign of a good design. With that in mind, we can see that when it comes to RCI-HI, all operational conditions produce satisfactory results with the exception of the low-volume air supply (21°C/80% and 21°C/100%). When we look at the RCI-LO coefficients, only the configuration with 21°C would satisfy our requirements. When we combine the two coefficients, we are left with two possible configurations: 21°C/120% and 21°C/140%.
As a final step, let’s calculate how much energy we can save by choosing one of the two cooling system designs. Using the cost of $33,150 for 13°C/100% as an arbitrary reference, we can conclude that switching to the 21°C/120% would allow us to save 11% of the cooling costs.
Eager to Get Started with Your Own Simulation?
Making the right design decision for your facility depends on a variety of factors, such as power density, room size, budget and so on. Fluid flow simulation allows you to find the unique cooling system configuration that would fit your facility best and help you reduce your data center power consumption. To set up your own CFD simulation, simply create a free account on the SimScale cloud-based platform and upload your CAD model. If you’d like to learn more about the SimScale cloud-based platform and its capabilities, download this features overview.
For more details on the simulation presented in this article, watch the recording of this webinar:
If you want to read more about how CFD simulation helps engineers and architects improve building performance, download this free white paper.
References
- M. Poess and R. O. Nambiar, “Energy cost, the key challenge of today’s data centers: A power consumption analysis of TPC-C results,” Proc. VLDB Endowment, vol. 1, no. 2, pp. 1229–1240, Aug. 2008

