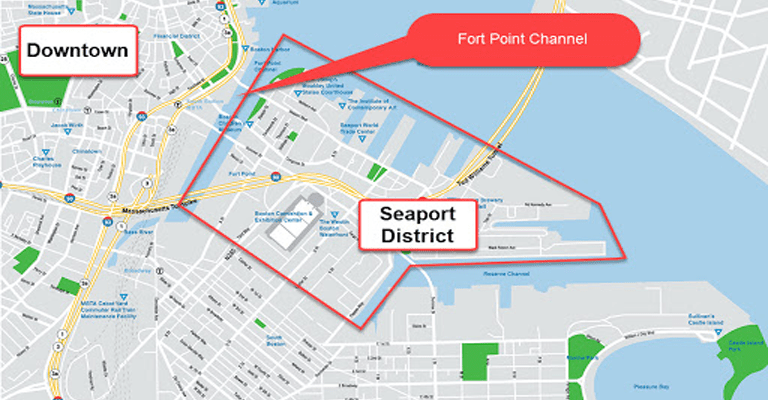
The Boston Harbor is of the most historically significant ports in American history. From being the site of the Boston Tea Party in 1773, the harbor has remained a thriving seaport and shipping area for Massachusetts and beyond. In its most recent iteration, the harbor has become a focal point for east coast construction and mass urbanization. The Seaport is centered downtown, adjacent to major roadways, and close to the airport, making it a prime location for development and expansion. Locals and tourists alike can speak about the seemingly constant existence of cranes and scaffolding erecting apartment blocks, office buildings, and retail outlets in this area. Yet, as urbanization changes the economic value and skyline of Boston’s Seaport, one must stop to consider how these new structures will affect the environment on a pedestrian level.
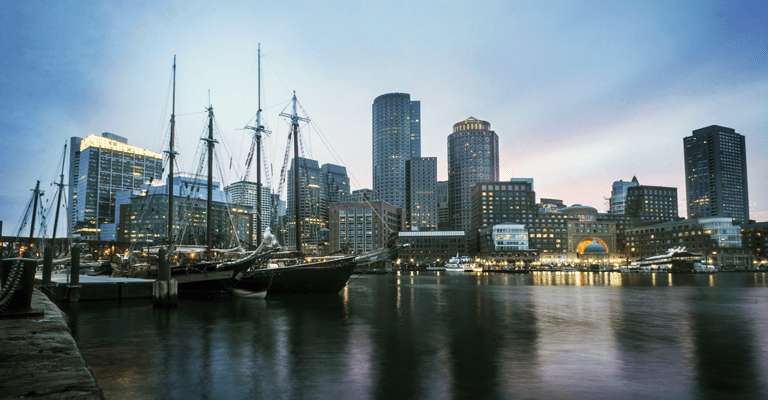
Waterfront Weather Conditions
Waterfront cities and communities are often confronted with windy weather. As they neighbor bodies of water, these areas can experience unusually high pedestrian discomfort due to powerful winds from the ocean and the subsequent Venturi effect caused by surrounding structures. This effect occurs when velocity increases, as fluid (in this case, air) passes through a constriction of any kind. This means buildings and other obstructions will force an increase in wind speed through city streets and other unobstructed channels, leading to passerby-level discomfort. Architects and building designers are increasingly considering pedestrian wind comfort during initial design phases. Building location, as well as orientation, can be optimized to minimize discomfort for waterfront areas if localized weather conditions are realized and taken into account.
South Boston Weather
Boston, Massachusettes, experiences all four seasons in a year. The weather is constantly changing, to the extent that locals have taken to the expression, ‘if you don’t like the weather, wait five minutes’. With annual temperature averages ranging from -5.5 °C to 26.6°C, Boston experiences harsh winters, hot summers, and everything in between.
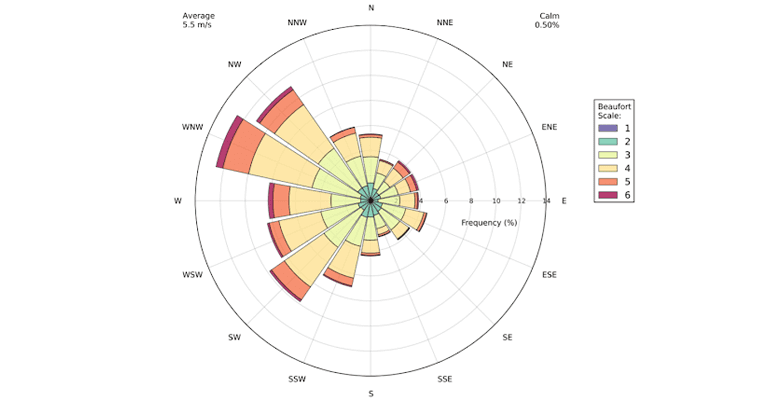
Boston Waterfront on the Beaufort Wind Force Scale
In addition to these fluctuating weather patterns, Boston’s Seaport experiences strong winds coming off the Atlantic Ocean. According to wind speed data from Logan Airport, for over 13% of the year, Boston at large is at a level 6 on the Boston Waterfront on the Beaufort Wind Force Scale, which is considered quite high.
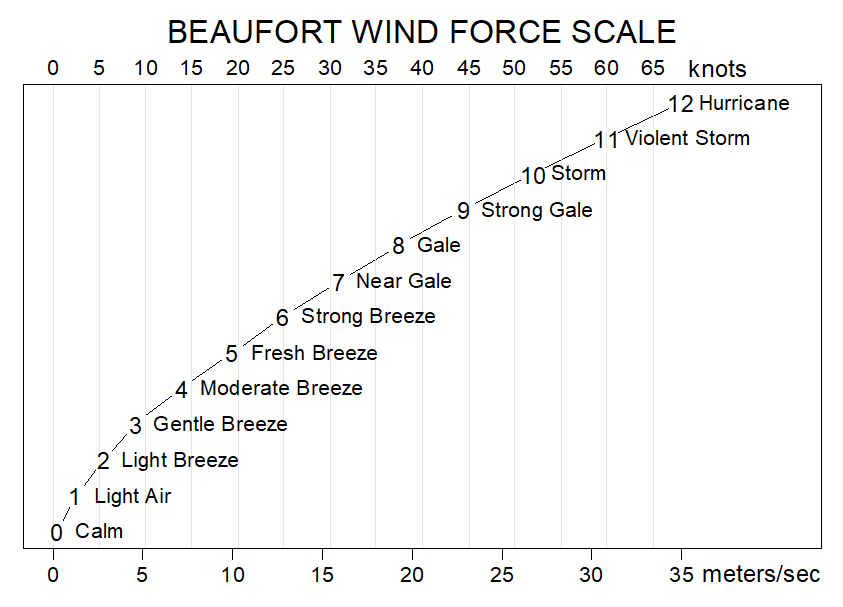
The Beaufort Wind Force Scale is used widely across the world for measuring wind speeds in all types of climates and can be seen below. In most cities, the wind force tends to fluctuate between 0 and 8.
If you take into account that twice a day, thousands of pedestrians walk across Fort Point Channel between their offices and South Station Terminal alongside thousands of tourists exploring the city, waterfront wind effects quite a lot of pedestrians daily. Not only does this have an effect on the general comfort of passersby, but also on the economic success of the surrounding establishments. Other outcomes could include shops being untenanted, parks being underutilized, and in extreme cases even personal injury. To avoid these negative outcomes, wind engineering must be employed in the planning process of Boston’s continuous urbanization.
Wind Engineering: Lattice Boltzmann Method (LBM)
In order to investigate further the wind effect on the Boston Seaport at a pedestrian level, wind engineering and subsequent evaluation are needed. In order to simulate the seaport in resource-saving, online simulation using Lattice Boltzmann methods (LMB) is a great option. Lattice Boltzmann methods (LBM) are meshless CFD algorithms which use collision theories to predict fluid behavior. Some advantages to employing this methodology include less computational time, less computational power, simple and easy procedure. In the following case study, this method will be employed to explore the wind effect on the Boston Seaport.
Case Study: Seaport Boulevard, Boston, MA.
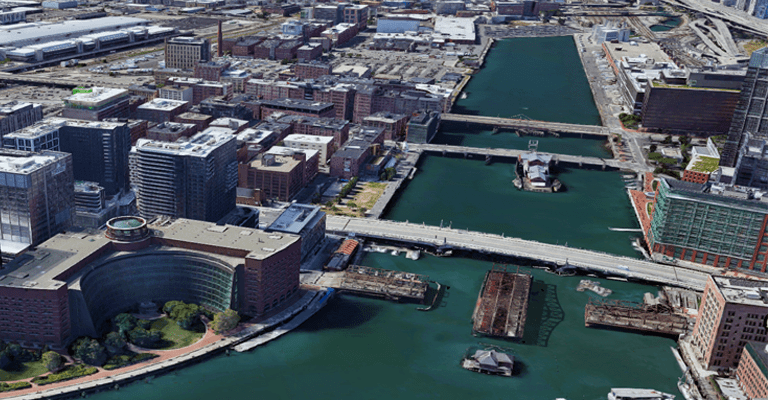
The overarching objectives of this wind experiment were to simulate how wind from the harbor affects pedestrians, pinpoint windy areas in the local vicinity that receive a lot of foot traffic, and become familiar with LBM and using SimScale to determine pedestrian wind comfort through online wind engineering. The project aims to determine two things conclusively; Does the Venturi Effect increase wind speed and discomfort on the Fort Point Channel bridges? And what is the wind profile of this area?
Simulation Setup
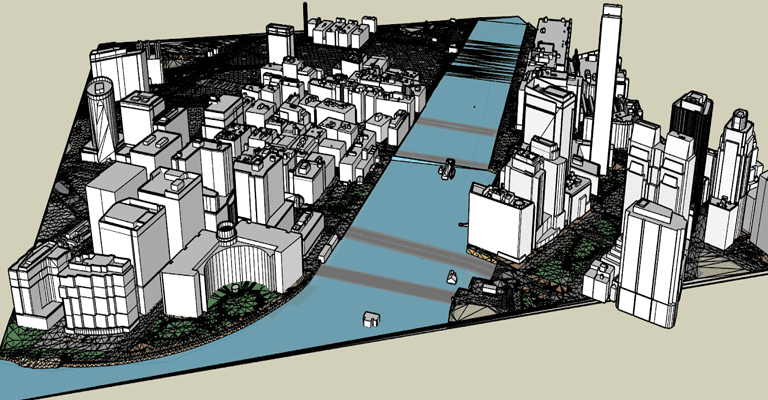
A CAD model of Seaport Boston was created, and an atmospheric boundary layer obtained via spreadsheet calculations. The aerodynamic roughness was assumed to be 0.0002 (ocean), and the weather data assumed to be collected at 10 meters. The model was simulated with wind direction set to West-Southwest, 22.5° counter-clockwise at 14 m/s (or about a level 6 on the Beaufort Wind Force Scale). Check out the public project to determine the mesh refinements and other boundary conditions applied.
Simulation Results
As you can see in the results pictured below, the airflow enters the Seaport at 14 m/s (in red) and then fluctuates between this speed and 0 m/s (blue) as it gets further from the port.
The LBM simulation revealed that certain buildings and coupled with narrow pathways create the Venturi effect, creating a high and unsteady turbulent flow that proves to be uncomfortable for pedestrians, and induces large wind velocity fluctuations.
Want to learn how to run wind experiments using online simulation? Watch our webinar to see the project simulated in real time and become a CFD master now:


