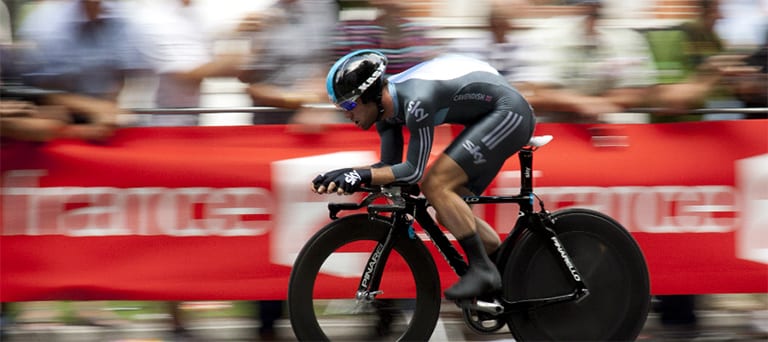
The aerodynamics of cycling have preoccupied bicycle designers and riders alike since the early part of this century. Competitive cycling—and Tour de France in particular—is a sport where speed and minimal air resistance are everything. As much as 90% of the resistance a rider has to overcome is the aerodynamic drag. To minimize this drag, riders try anything from wearing pointy streamlined helmets and tight-fitting bodysuits to shaving their legs and taking unexpected postures on their bikes.
Recently, daredevil cyclist, Michael Guerra, demonstrated just how much it can influence a cyclist’s speed by taking his feet off the pedals altogether and achieving a stunning level of aerodynamic efficiency. The video he uploaded to Facebook has since gone viral, amassing over 10 million views and 22 thousand comments.
Cycling Aerodynamics Calculating Aerodynamic Drag
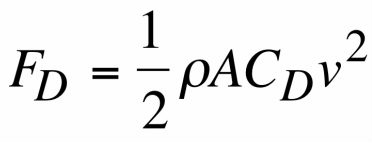
In order to better understand the aerodynamics of cycling, it is important to first understand how air resistance is calculated. Below is the drag equation that represents the drag force, 

The second factor is 


Cycling Aerodynamics Aerodynamics of Cycling Visualized
Nicole, the author of the popular FY Fluid Dynamics Tumblr, teamed up with the University of Colorado at Boulder and SimScale to explore the aerodynamics of cycling using high-speed video, flow visualization, and computational fluid dynamics (CFD).
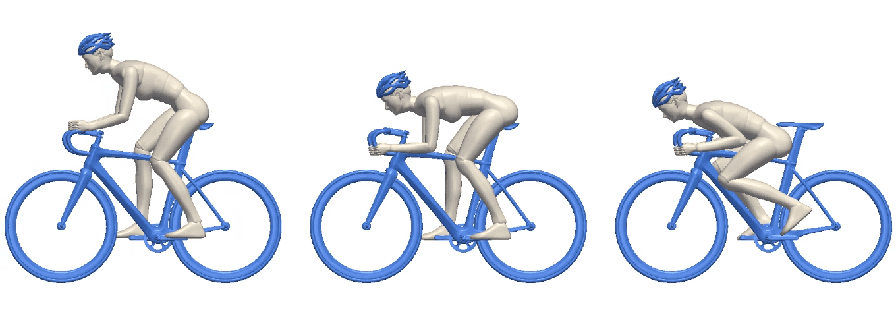
For this video, the airflow around a cyclist in three different positions was simulated. The first is an upright position with the hands on top of the handlebars. Here most of the cyclist’s torso is presented to the wind, so it is not expected to be a very aerodynamic position. The second position puts the rider’s hands lower on the handlebars in what cyclists call the “drops”—it leans the rider further forward and is a typical racing position both on flat terrain and on the descent. The last position has the rider crouched even lower, on the bike’s top tube—it’s extremely hard to pedal in this position so it’s only used when riding downhill.
The three positions vary greatly in the frontal area 
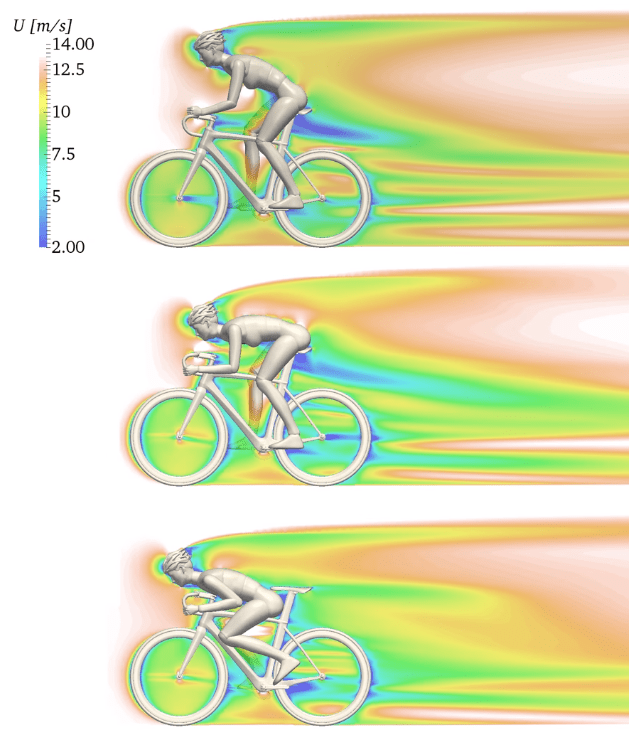
To understand why, consider the airflow around the three cyclists. The simulation image on the left shows air velocity around the cyclists. Notice that there is a large region of slower velocity right behind the saddle, especially in the case of the upright cyclist, which indicates a lot of drag. By getting lower on the bike, the cyclist is able to shrink the extent of this slow-moving region, but can never get rid of it completely, even in the top tube position.
The 3D structure indicates an association between the different parts of the flow with the areas on the cyclist—for example, the slower area associated with the cyclist’s head, which fades as they move away. There is also a distinctive asymmetry to the cyclist’s wake—it comes from the way the air flows around the cyclist’s torso and legs, so it would change with the leg position as the cyclist pedals.
Other positions demonstrate some distinctive differences. In the “drops” position, the helmet area fades more quickly and we see a little less asymmetry behind the cyclist’s body. With the cyclist crouched on the top tube, the region of the slower air gets compressed and the cyclist is overall much more streamlined.
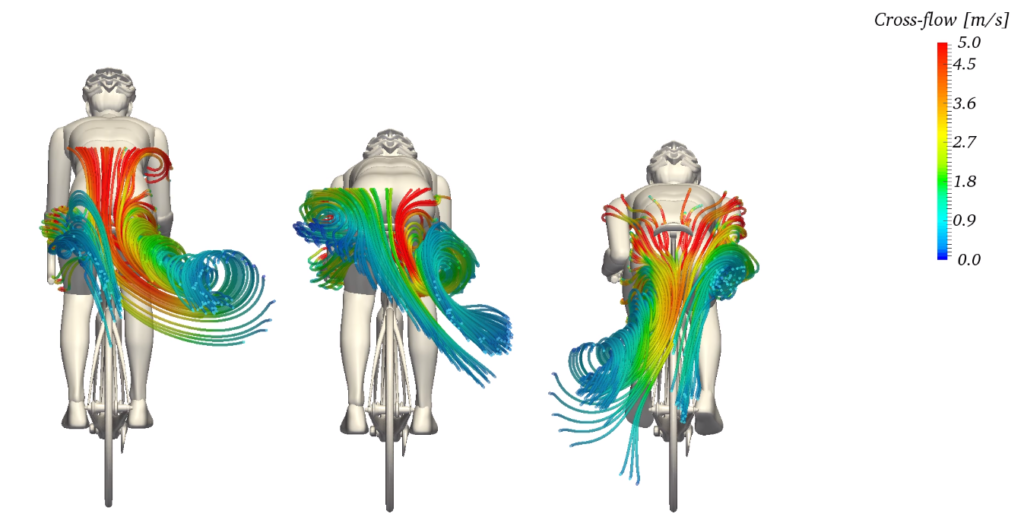
To get a sense of the rotation in the cyclist’s wake, one must look at the streamlines. The difference between the riding positions can be appreciated when seen from behind. It is shown that getting lower makes a big difference—the vortices become smaller and the cross-flow velocities are reduced.
The purpose of a helmet is to protect the person who wears it from a head injury during impact. In this project, the impact of a human skull with and without a helmet was simulated with a nonlinear dynamic analysis. Download this case study for free.
Conclusion
The equipment and race strategy at Tour de France are centered around aerodynamic efficiency. The rules, however, state that “it is forbidden to wear non-essential items of clothing or items designed to influence the performances of a rider such as reducing air resistance or modifying the body of the rider” (article 1.3.033). This year, the Sky riders are already at the center of a controversy because their new Castelli skinsuits with textured patterns were designed to act as vortex generators. Officials are usually quick to punish such infractions; however, a rider’s position can give the cyclist an aerodynamic advantage without violating the rules. CFD can be particularly helpful in evaluating the effectiveness of such technique and coming up with a competitive strategy, which is what FYFD demonstrated in their video on the aerodynamics of cycling.
To learn more about how aerodynamics help athletes achieve top performance, have a look at the SimScale’s Sports Aerodynamics Workshop, which teaches how to predict and optimize designs for sports applications.


